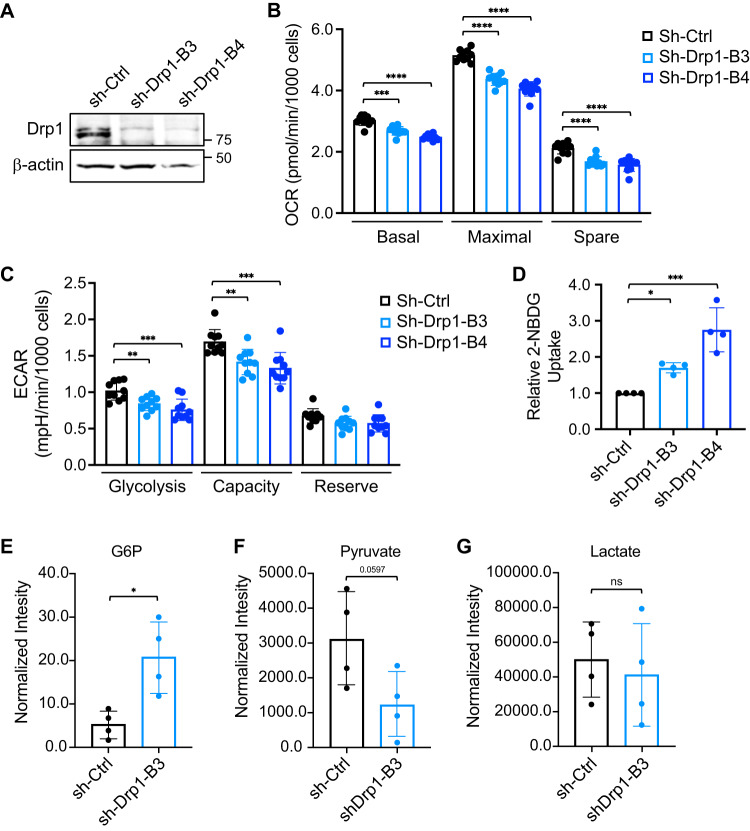
Fig. 1. Knockdown of Drp1 alters glucose metabolism.
A Cell lysates of control (sh-Ctrl) and two Drp1 knockdown (sh-Drp1-B3 and sh-Drp1-B4) PT130 cells were analyzed for the expression of Drp1 and β-actin using western blot. B Control and Drp1 knockdown PT130 cells were subjected to Mito Stress tests using Seahorse XF96 Extracellular Flux Analyzer as described in Materials and methods. The OCR measurements associated with basal, maximal, and spare capacity of mitochondrial respiration were calculated by normalizing to total cell numbers. Data represent the mean ± SD (n = 10, ***p < 0.001 and ****p < 0.0001). C Control and Drp1 knockdown PT130 cells were subjected to Glycolysis Stress tests using Seahorse XF96 Extracellular Flux Analyzer. The ECAR measurements associated with glycolysis, glycolytic capacity, and glycolytic reserve were calculated by normalizing to total cell numbers. Data represent the mean ± SD (n = 10, **p < 0.01 and ***p < 0.001). D Control and Drp1 knockdown PT130 cells were incubated with 2-NBDG and Hoechst in low glucose media for 1 h. Relative glucose uptake was calculated by normalizing fluorescence signals detected from 2-NBDG to Hoechst. Data were presented as mean ± SD (n = 4, *p < 0.05 and ***p < 0.001). E–G Control and Drp1 knockdown PT130 cells were cultured in low glucose media for 18 h. Polar metabolites were extracted and analyzed using GC-MS. The levels of metabolites, including G6P (E), pyruvate (F), and lactate (G), in the glycolytic pathway are shown. Data were presented as mean ± SD (n = 4, *p < 0.05).

