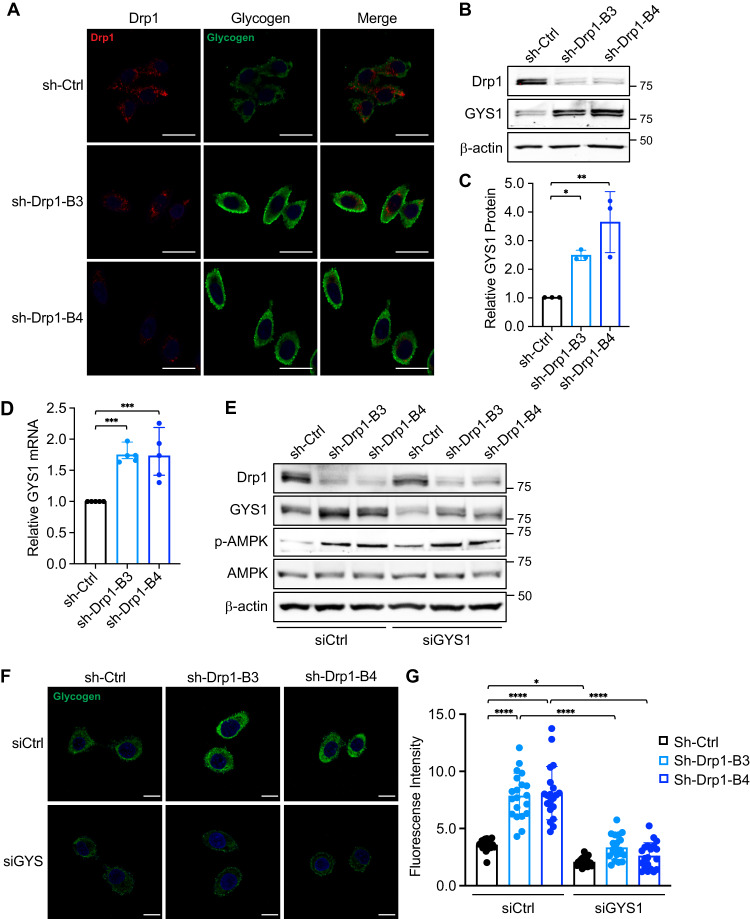
Fig. 2. Knockdown of Drp1 promotes glycogen accumulation.
A Representative confocal images of control (sh-Ctrl) and Drp1 knockdown (sh-Drp1-B3 and sh-Drp1-B4) PT130 cells that were stained with antibodies against Drp1 (red) and glycogen (green). Scale Bar, 20 μm. B Cell lysates from sh-Ctrl and sh-Drp1 PT130 cells were analyzed for the expression of Drp1, GYS1 and β-actin using western blot. C Representative western blots as shown in (B) were quantified to determine the relative GYS1 levels by normalizing GYS1 to β-actin. Data were presented as mean ± SD (n = 3, *p < 0.05 and **p < 0.01). D sh-Ctrl and sh-Drp1 PT130 cells cultured in low glucose media were analyzed for the expression of GYS1 mRNA using RT-qPCR. Data were presented as mean ± SD (n = 3, ***p < 0.001). E Sh-Ctrl and sh-Drp1 PT130 cells were transfected with non-targeting (siCtrl) or GYS1-specific siRNA to silence GYS1 expression. Cell lysates were analyzed for the expression of Drp1, GYS1, p-AMPK, AMPK, and β-actin using western blot. F Sh-Ctrl and sh-Drp1 PT130 cells were transfected as described in (E). Representative confocal images were obtained from cells stained with the anti-glycogen antibody. Scale Bar, 10 μm. G The relative fluorescence intensity of glycogen staining was quantified using ImageJ fluorescence analyzer. Data were presented as mean ± SD (n = 20, *p < 0.05 and ****p < 0.0001).

