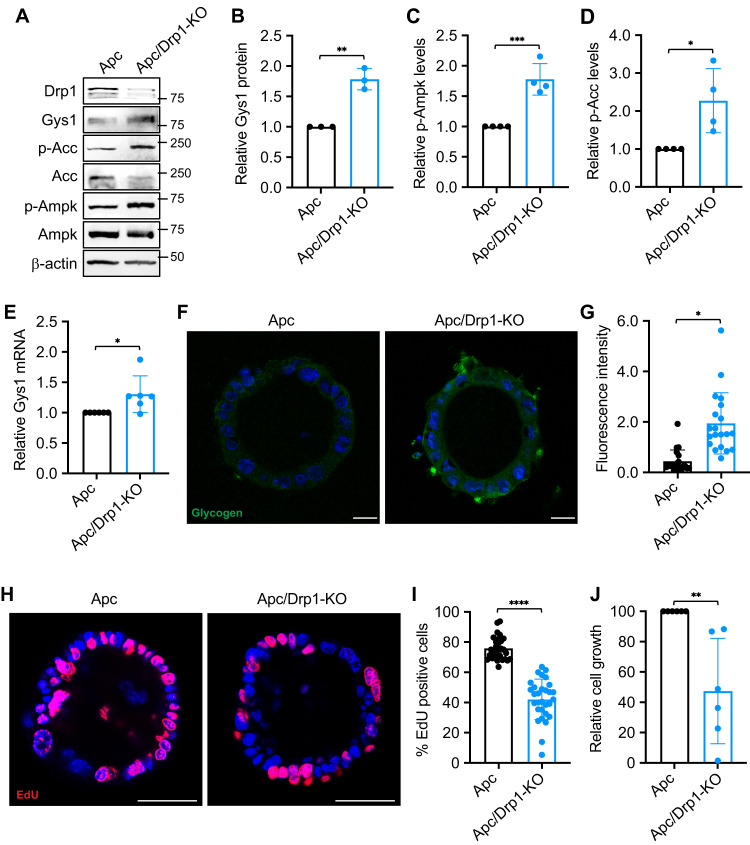
Fig. 4. Depletion of Drp1 in APC-derived tumor organoids increases glycogen storage.
A Apcf/f/Vil-CreERT2 (Apc) and Apcf/f/Drp1f/f/Vil-CreERT2 (Apc/Drp1-KO) organoids were cultured in 3D Matrigel for 4 days. Cell lysates from organoids were analyzed for the levels of Drp1, Gys1, p-Acc, total Acc, p-Ampk, total Ampk and β-actin using western blot. B–D Representative western blots as shown in (A) were quantified to determine the expression Gys1, p-Ampk and p-Acc. The relative expression levels of Gys1 were obtained by normalizing Gys1 to β-actin (B), whereas the phosphorylation levels of Ampk and Acc were determined by normalizing p-Ampk and p-Acc to that of total AMPK and Acc, respectively (C, D). Data were presented as mean ± SD (n = 4, *p < 0.05, **p < 0.01 and ***p < 0.001). E The relative expression of Gys1 mRNA was determined using RT-qPCR in Apc and Apc/Drp1-KO organoids. Data were presented as mean ± SD (n = 6, *p < 0.05). F Representative confocal images were obtained from Apc and Apc/Drp1-KO organoids stained with the anti-glycogen antibody. Scale Bar, 20 μm. G The relative fluorescence intensity of the glycogen staining was quantified using ImageJ fluorescence analyzer. Data were presented as mean ± SD (n = 20, *p < 0.05). H Apc and Apc/Drp1-KO organoids cultured in 3D Matrigel for 3 days were labeled with EdU to mark proliferating cells. EdU positive cells were visualized using Click-it EdU Alexa 594. I The percentage of EdU positive cells were quantified in Apc and Apc/Drp1-KO organoids. Data were presented as mean ± SD (n = 30, ****p < 0.0001). J The relative cell growth of Apc and Apc/Drp1-KO organoids were quantified using the CellTiter-Glo 3D Luminescent Cell Viability Assay Kit. The luminescence signals were normalized to the number of organoids formed. Data were presented as mean ± SD (n = 6, **p < 0.01).

