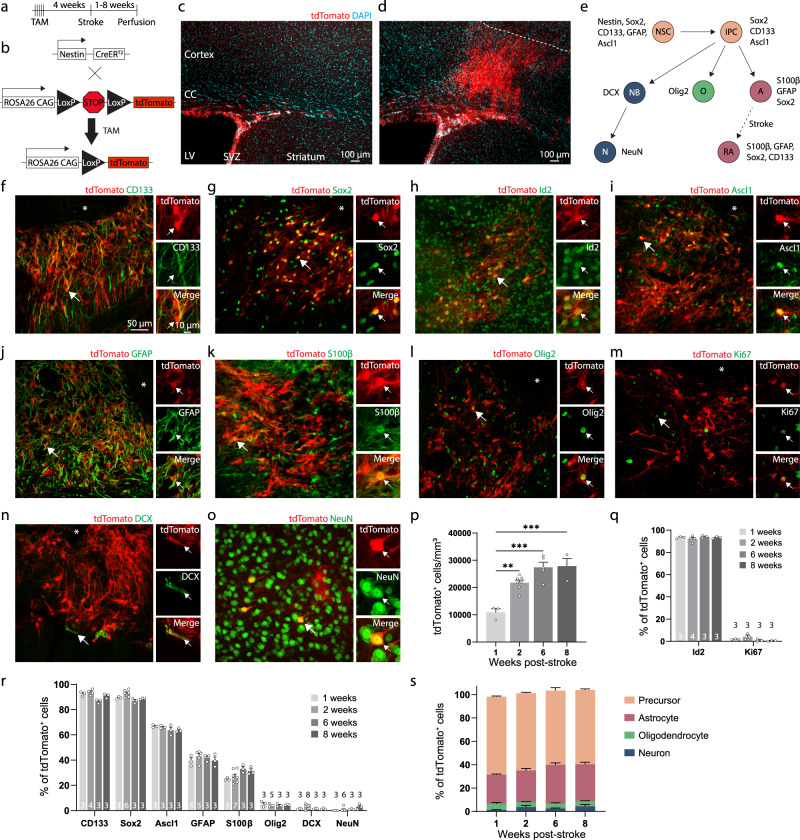
Fig. 1. SVZ-derived cells are predominantly undifferentiated precursors.
a Experimental timeline. b Schematic of lineage tracing system. c Image of tdTomato-expressing cells in the subventricular zone in the absence of injury. CC, corpus callosum; LV, lateral ventricle; SVZ, subventricular zone. d Substantial migration of tdTomato+ cells towards the infarct after cortical photothrombotic stroke (dashed line indicates the approximate infarct border). Images in (c, d) are representative of experiments repeated in 4 mice. e Schematic of differentiation stages as defined by marker expression. Neural stem cells (NSC) produce intermediate progenitor cells (IPC), which give rise to cells of the three major neural lineages: neurons (NB, neuroblast; N, neuron), oligodendrocytes (O), and astrocytes (A). After stroke, reactive astrocytes (RA) re-express some neural stem cell markers. f–o Representative confocal images from peri-infarct cortex of tdTomato+ cells and immunostaining for various markers. Asterisks indicate the lesion core. Scale is the same for (f–o). Staining for: (f) CD133, (g) Sox2, (h) Id2, (i) Ascl1, (j) GFAP, (k) S100β, (l) Olig2, (m) Ki67, (n) NeuN, and (o) DCX. p Quantification of the number of tdTomato+ cells in peri-infarct cortex across time after stroke. **p = 0.0025, ***p ≤ 0.0002, one-way ANOVA and Tukey’s post-hoc tests. n = 3 (1 week), 7 (2 week), 5 (6 week), 3 (8 week) mice. q Quantification of quiescence- (Id2) and proliferation-related (Ki67) marker expression. The number of mice used for each marker is indicated on the bottom of each bar. r Quantification of differentiation stage and lineage-specific marker expression in tdTomato+ cells. The number of mice used for each marker is indicated on the bottom of each bar. s Estimate of phenotype distribution of lineage traced cells. n is the same as in panel r. Precursors were defined by Ascl1. Astrocytes were defined by S100β. Oligodendrocyte lineage was defined by Olig2. Neuron lineage was defined by DCX and NeuN. Data are presented as mean ± SEM. Source data are provided as a Source Data file.

