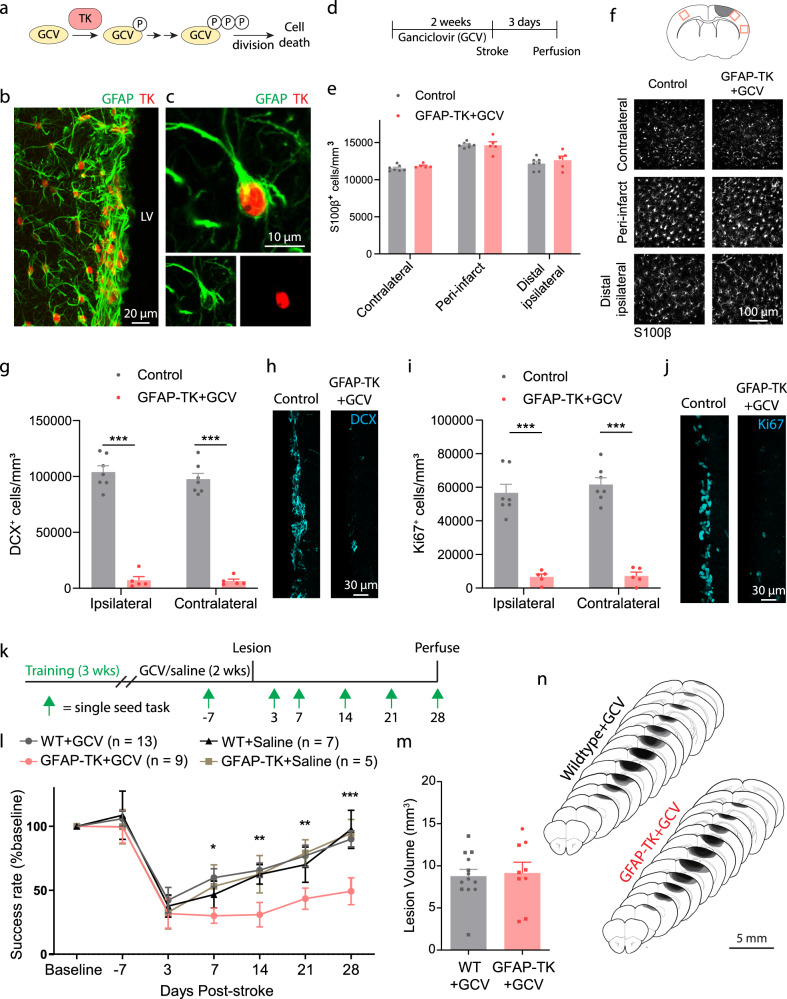
Fig. 2. Ablation of neural stem cells worsens recovery after stroke.
a Schematic illustrating the thymidine kinase (TK)/ganciclovir (GCV) system for conditional ablation of proliferating cells. b Confocal image showing TK expression in GFAP+ cells of the subventricular zone in a GFAP-TK mouse. LV, lateral ventricle. c High-resolution image of a TK-expressing SVZ stem cell. Images in (b, c) are representative of experiments repeated in 3 mice. d Experimental timeline for assessing the specificity and effectiveness of arresting SVZ cytogenesis with GFAP-TK mice (E–J). GCV or saline was delivered for 14 days via osmotic pump. Tissue was collected 3 days after stroke. e Parenchymal astrocytes were not depleted in this paradigm. t(10) < 1.53, p ≥ 0.157, two-tailed t tests comparing groups for each region. n = 7 control (wildtype mice given GCV or GFAP-TK mice given saline), n = 5 GFAP-TK + GCV mice. f Representative images of S100β+ cells from three cortical regions (see diagram at top) show lack of astrocyte ablation. g–j GFAP-TK mice permit conditional arrest of cytogenesis. The number of SVZ DCX+ (g, h) and Ki67+ cells (i, j) was significantly reduced in GFAP-TK mice given GCV (n = 5) relative to controls (n = 7). ***t(10) ≥ 7.99, p < 0.0001, two-way t tests. k Experimental design for assessing motor recovery after photothrombotic stroke with the single seed reaching task. l Arrest of cytogenesis significantly worsened recovery of motor function. Time x group interaction F(18, 174) = 2.19, p = 0.0052. *p = 0.030, **p ≤ 0.007, ***p = 0.0007 GFAP-TK + GCV compared to at least one control group, two-way ANOVA and post-hoc Tukey’s tests. WT = wildtype. m Lesion volume was not different between groups. t(20) = 0.27, p = 0.787. Two-tailed t test. n = 13 WT + GCV, n = 9 GFAP-TK + GCV mice. n Lesion reconstruction. Darker shades represent more overlap between animals. Data are presented as mean ± SEM. Where individual datapoints are shown, datapoints representing males are shown as circles; datapoints representing females are shown as squares. Source data are provided as a Source Data file.

