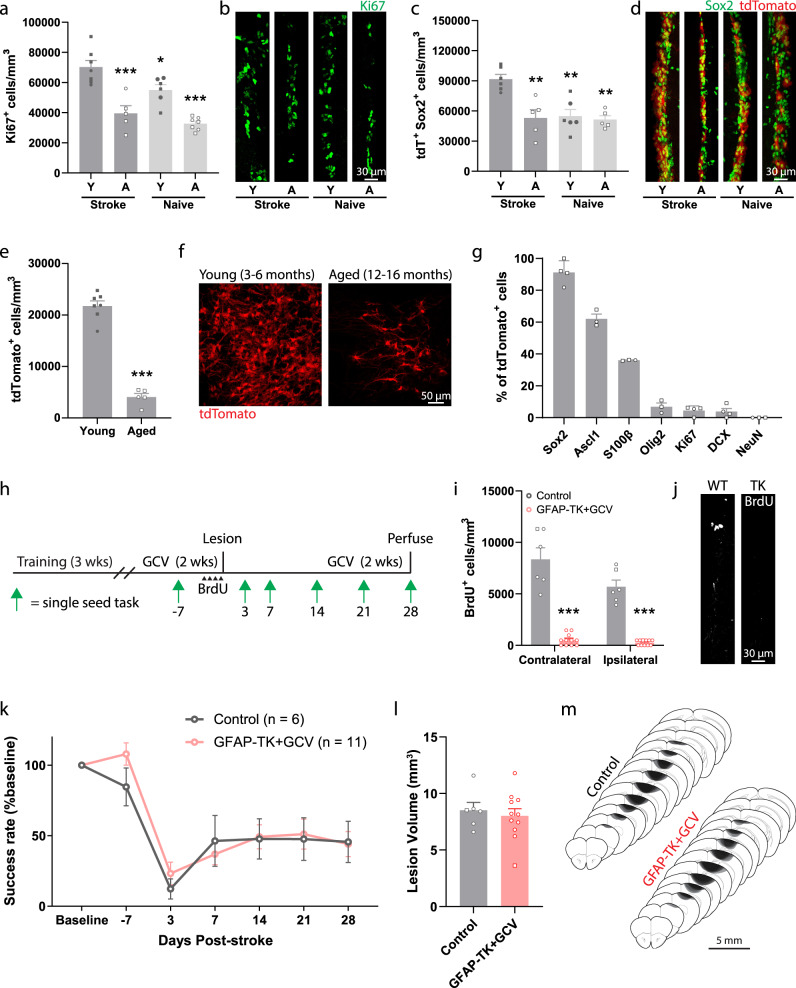
Fig. 3. Aging diminishes the cytogenic response to stroke and its contribution to recovery.
a–d Assessment of SVZ cytogenesis in young (Y, 3–6 months) and aged (A, 12–16 months) NestinCreERT2; Ai14 mice. Tissue was collected two weeks post-stroke. The number of proliferating cells (Ki67+, (a, b); n = 7 young+stroke, 5 aged+stroke, 6 young+naïve, 7 aged+naïve mice.) and neural precursor cells (tdTomato+ Sox2+, (c, d); n = 6 young+stroke, 5 aged+stroke, 6 young+naïve, 5 aged+naïve mice.) in the SVZ was significantly higher in young mice after stroke compared to all other groups. *p = 0.036, **p ≤ 0.0016, ***p < 0.0001 relative to young stroke mice, one-way ANOVA and post-hoc Tukey tests. e Fewer tdTomato+ cells were observed in peri-infarct cortex of aged mice two weeks post-stroke. ***t(10) = 13.4, p < 0.0001. Two-tailed t test. n = 7 young, 5 aged mice. f Representative images of tdTomato+ cells in peri-infarct cortex. g Quantification of lineage marker expression by tdTomato+ cells in peri-infarct cortex of aged mice at two weeks post-stroke (n = 3 or 4 mice per marker). Similar to what was observed in young mice (Fig. 1), most SVZ-derived cells were undifferentiated precursors or astrocytes. h Experimental timeline for examining the effects of neural stem cell ablation in aged mice. i GFAP-TK + GCV mice had fewer BrdU+ cells in the SVZ, validating stem cell ablation. ***t(15) ≥ 9.36, p < 0.0001. Two-tailed t test. n = 6 control, 11 GFAP-TK + GCV mice. BrdU was given twice per day for two days prior to stroke. j Representative images of BrdU immunostaining in the SVZ. k Both aged controls and GFAP-TK + GCV mice showed poor recovery following stroke. There was no difference between groups. Group main effect F(1,15) = 0.17, p = 0.690. Two-way ANOVA. l Lesion volume was not different between groups (t(15) = 0.50, p = 0.628, two-tailed t test). n = 6 control, 11 GFAP-TK + GCV mice. m Lesion reconstruction. Darker shades represent more overlap between animals. Data are presented as mean ± SEM. Where individual datapoints are shown, datapoints representing males are shown as circles; datapoints representing females are shown as squares. Source data are provided as a Source Data file.

