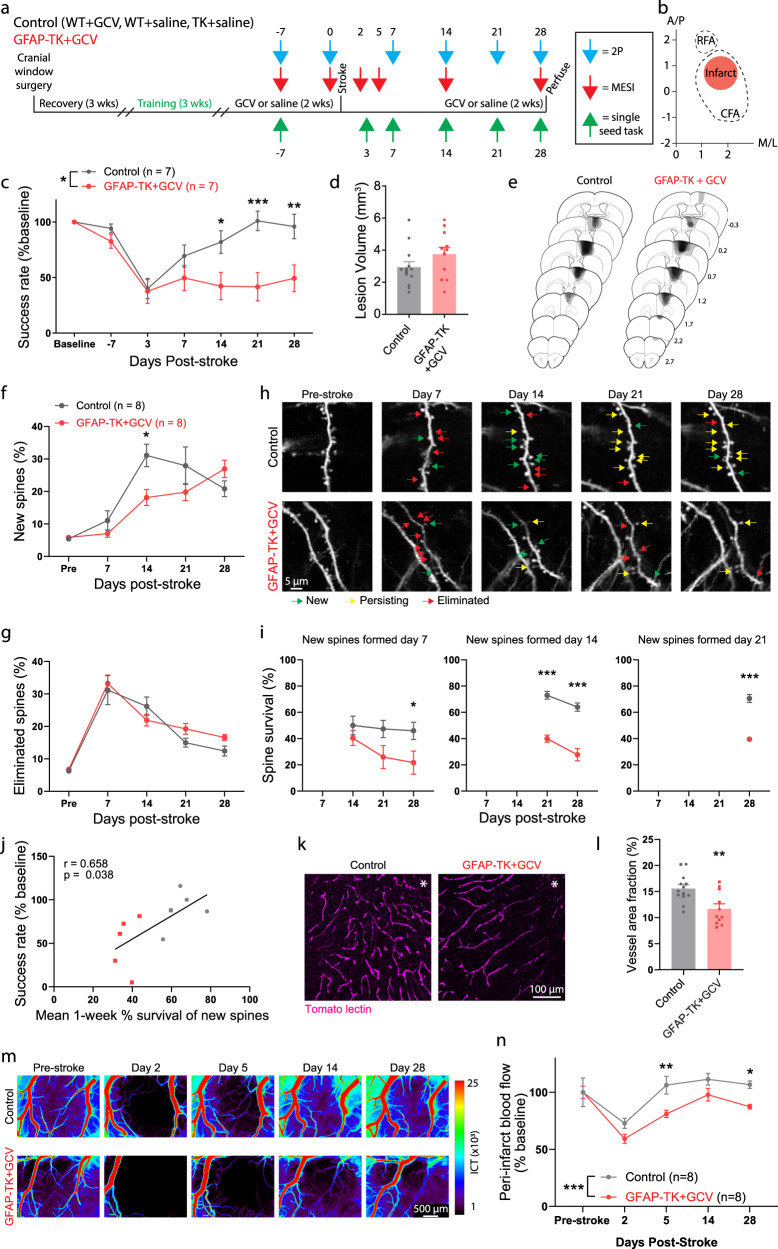
Fig. 4. SVZ cytogenesis supports neuronal and vascular remodeling.
a Experimental design. b Schematic illustrating infarct placement relative to caudal (CFA) and rostral (RFA) forelimb areas in motor cortex. Axes indicate mm relative to Bregma. c Performance on the reaching task. GFAP-TK + GCV mice showed significantly worse recovery relative to control mice (Two-way ANOVA, significant group x time interaction, F(6, 72) = 4.7, p < 0.001). *p = 0.026, **p = 0.005, ***p = 0.0002, post-hoc Bonferroni tests. d Lesion volume was not different between groups (t(22) = 1.5, p = 0.159). Two-tailed t test. n = 13 control, 11 GFAP-TK + GCV mice. e Lesion reconstructions. f–j Altered spine dynamics. f New spine formation was significantly higher in control mice on day 14 (Two-factor mixed-effects model, significant time x group interaction, F(4,52) = 4.1, p = 0.006). *p = 0.011, Sidak’s multiple comparison tests between groups for each day. g Spine elimination was not significantly different (Two-factor mixed-effects model, group effect, F(1, 66) = 1.2, p = 0.285). n = 8 mice/group. h Longitudinal images of dendritic spines illustrating formation (green), persistence of new spines (yellow), and elimination (red). i Survival of new spines was reduced in GFAP-TK + GCV mice. Two-factor mixed-effects model and post-hoc Sidak’s multiple comparison tests, *p = 0.038, ***p < 0.0001. n = 8 mice/group. j Spine survival was correlated with behavioral performance on the final day of testing. Linear regression, F(1,8) = 6.1, p = 0.038. n = 5 mice/group. k Representative images of peri-infarct vasculature. l Peri-infarct vessel density was reduced in GFAP-TK + GCV mice (**t(22) = 3.3, p = 0.004). Two-tailed t test. n = 13 control, n = 11 GFAP-TK + GCV mice. m Representative blood flow maps. n Peri-infarct blood flow was reduced in GFAP-TK + GCV mice (Two-way repeated measures ANOVA and post-hoc Sidak’s multiple comparison tests, group effect F(1, 14) = 32.98, p < 0.0001). *p = 0.020, **p = 0.0014. Data are presented as mean ± SEM. Where individual datapoints are shown, datapoints representing males are shown as circles; datapoints representing females are shown as squares. Source data are provided as a Source Data file.

