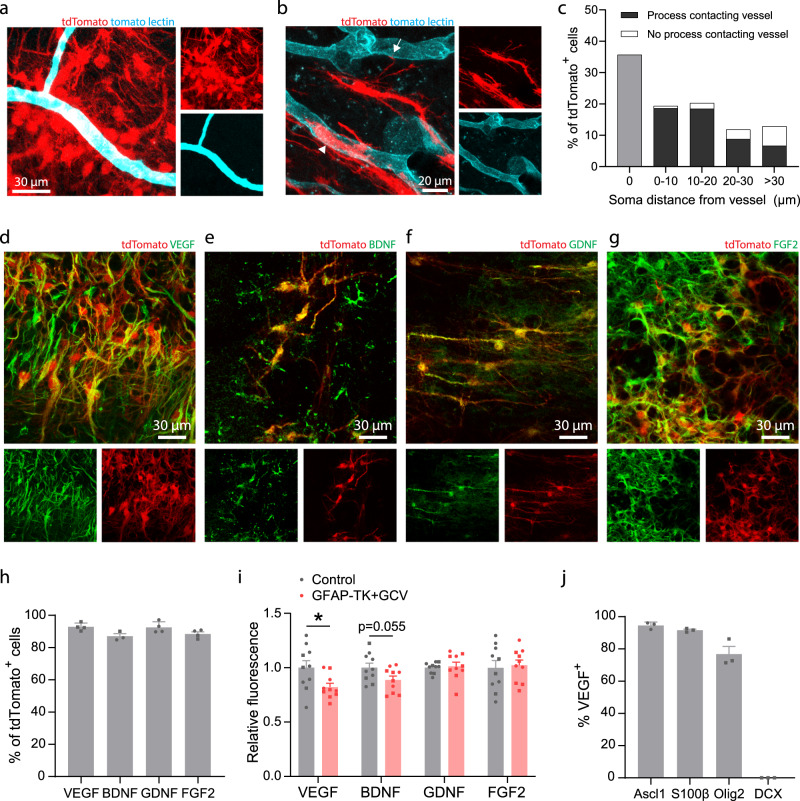
Fig. 5. SVZ-derived cells interact with vasculature and produce trophic factors.
a Confocal image showing clustering of lineage traced cells around blood vessels in peri-infarct cortex. b tdTomato-expressing cells were frequently observed with cell bodies abutting vessels (arrowhead) or extending processes that terminated on nearby vessels (arrow). Images in (a, b) are representative of experiments repeated in 3 mice. c Quantification of SVZ-derived cell interaction with vasculature in peri-infarct cortex two weeks post-stroke. Data are from 661 cells across 3 NestinCreERT2; Ai14 mice. d–g Confocal images from peri-infarct cortex showing expression of the trophic factors VEGF (d), BDNF (e), GDNF (f), and FGF2 (g) in tdTomato+ cells. h Quantification of trophic factor expression in tdTomato+ cells. n = 4 mice for VEGF, GDNF, and FGF2; n = 3 mice for BDNF. i Quantification of trophic factor expression in peri-infarct cortex four weeks post-stroke between control mice and GFAP-TK + GCV mice (n = 10/group). Fluorescence intensity is reported relative to controls. VEGF protein fluorescence was significantly reduced in GFAP-TK + GCV mice. *t(18) = 2.4, p = 0.025. Two-tailed t test. j Quantification of VEGF expression by phenotype in lineage traced cells. n = 3 mice per marker. VEGF was expressed by Ascl1+ precursors, S100β+ astrocytes, and Olig2+ oligodendrocyte-lineage cells, but not by neuronal lineage cells (DCX+). Data are presented as mean ± SEM. Where individual datapoints are shown, datapoints representing males are shown as circles; datapoints representing females are shown as squares. Source data are provided as a Source Data file.

