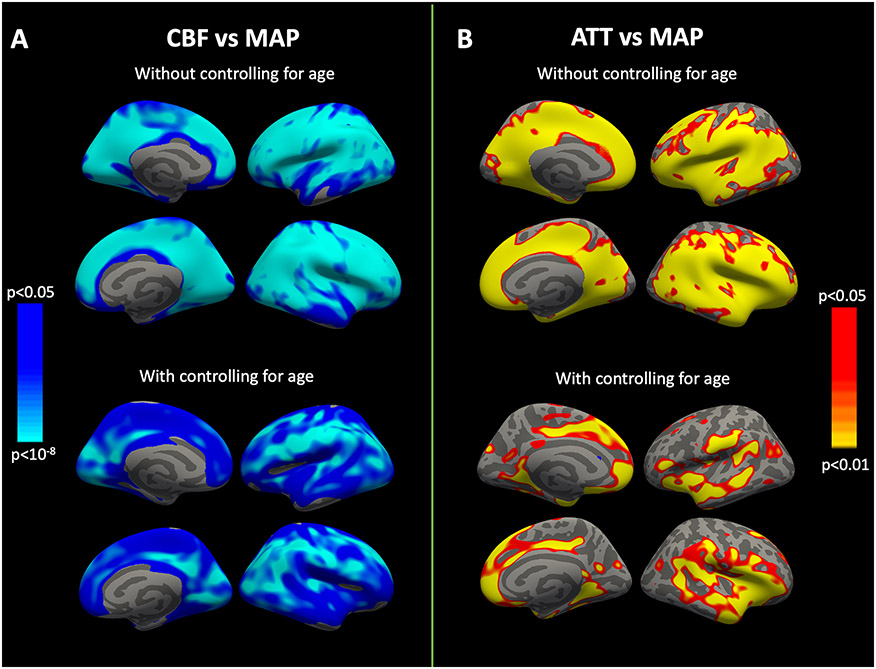
Figure 2: Vertex-wise analyses between MAP, CBF and ATT with and without adjustment for age.
Age-unadjusted associations between MAP and hemodynamic parameters display a widespread relationship (top row). After controlling for age effects (bottom row), this pattern mostly endured for CBF compared to ATT. Color bars indicate p-values and the direction of correlation; blue represents a negative correlation whereas red/yellow represents a positive correlation. CBF, Cerebral blood flow; ATT, Arterial transit time; MAP, Mean arterial pressure.

