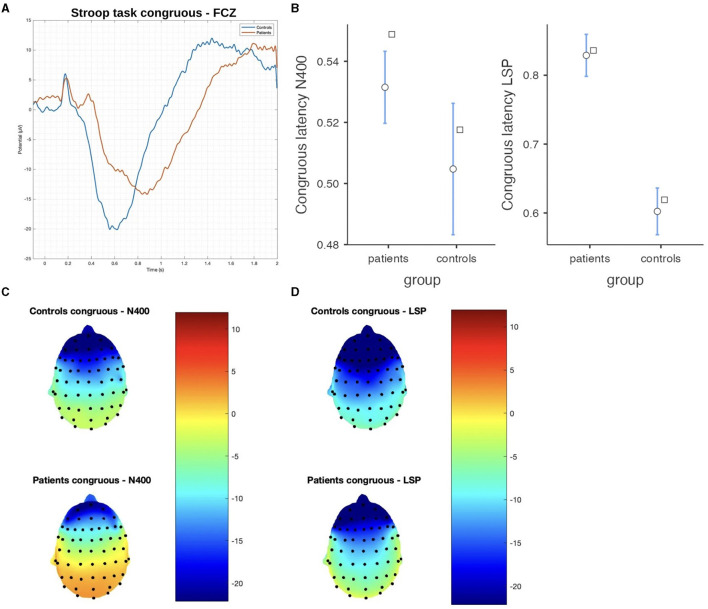
Figure 4.
The difference between patients and controls during the Stroop test for the congruous stimulus: (A) ERP grand average; (B) descriptive plots of the N400 and LPS latencies measured on the FCZ channel (p < 0.01); (C) topographical maps for the N400 effect; and (D) topographical maps for the late sustained potential (LSP). No significant difference in amplitude was detected.

