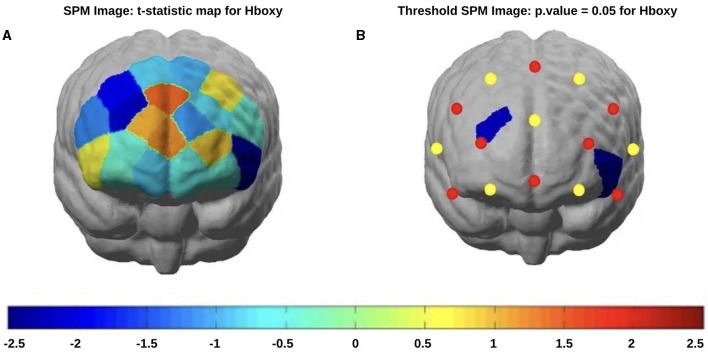
Figure 6.
fNIRS t-statistic maps of the brain regions during the Stroop task incongruous stimulus showing the differences in the oxyhemoglobin comparisons of patients (red) vs. controls (blue): (A) Stroop task incongruous stimulus without threshold) and (B) Stroop task incongruous stimulus with threshold (p < 0.05).

