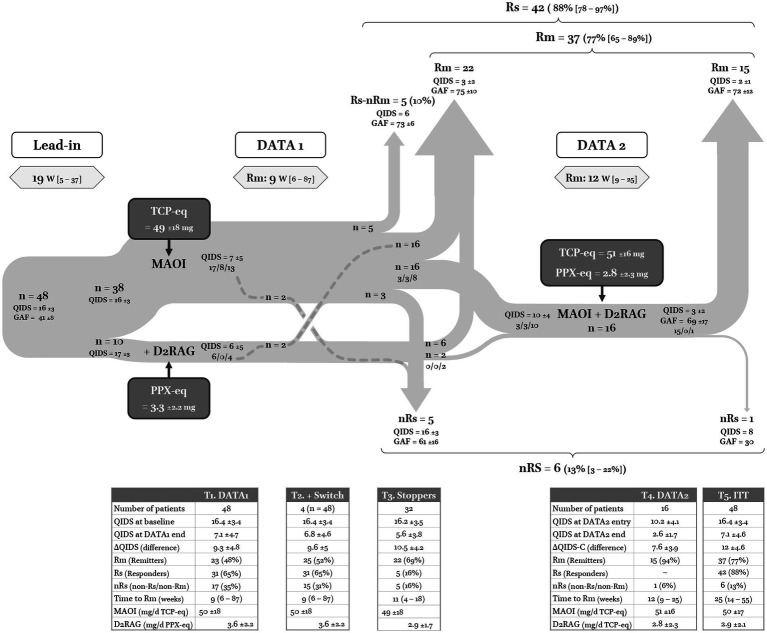
Figure 3.
Flow chart of DATA. The three numbers separated by split lines corresponds to remitters (Rm), responders but non-remitters (Rs-nRm), and non-responders (nRs). T1 (Table 1): outcomes of the first dopaminergic trial. TCP-eq: tranylcypromine equivalent doses for MAOI; PPX-eq: pramipexole equivalent doses for D2RAG. T2: same as T1 but adding the four patients who switched from MAOI to D2RAG or vice versa. T3: outcomes for all patients who stopped after DATA1 (only one dopaminergic class). T4: outcomes of patients who entered DATA2. T5: outcomes of all patients who had one prescription according to DATA guidelines. ITT: intention-to-treat analysis.

