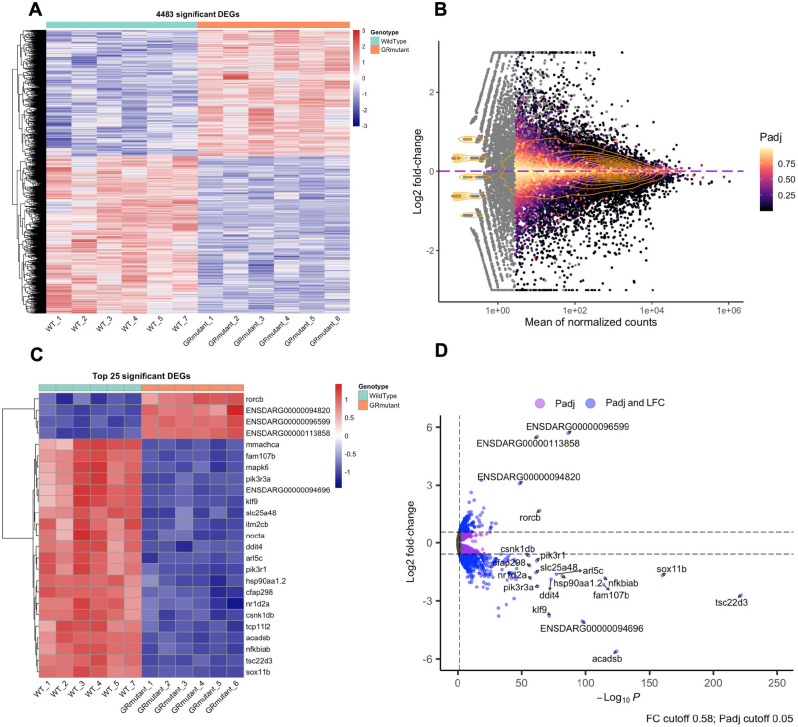
Fig. 3.
Differential gene expression in wild-type and GR-mutant brain transcriptomes of adult zebrafish. (A) Heatmap with hierarchical clustering of genes (rows) showing relative expression of all significant differentially expressed genes (DEGs) (P<0.05) in individual wild-type (n=6, cyan) and individual GR-mutant (n=6, orange) brains. Red indicates upregulation, blue indicates downregulation. (B) MA plot with overlaid density contour lines showing individual mean normalised counts for each transcript across all samples plotted against log2 fold-change (LFC) in average counts for each transcript between wild-type and GR-mutant adult brain samples. As the average mean of normalised counts increases, the requirements of a gene to be differentially expressed are more likely to be met. Grey points correspond to genes that were independently filtered from the analysis (high dispersion, low mean of normalised counts) and lack an adjusted P-value (Padj). The Padj threshold for statistically significant differential expression was set at P<0.05 and genes exhibiting significant differential expression are indicated by coloured points. A total of 4483 genes exhibit significant differential expression. Of those, 2001 genes are upregulated and 2482 are downregulated in GR-mutant brains compared to those of wild-type fish. (C) Heatmap with hierarchical clustering of genes (rows) showing relative expression of the top 25 most significant DEGs in individual wild-type (cyan) and GR-mutant (orange) brains. Of these genes, four are upregulated and 21 are downregulated in GR-mutant brains. (D) Volcano plot showing DEGs in transcriptomes of wild-type and GR-mutant adult brain. The statistically significant −log10 Padj values are plotted on the x-axis against LFC in counts for each transcript (magnitude of differential expression) on the y-axis. Dashed lines correspond to Padj and LFC cut-off values set at P<0.05 and 0.58, respectively. Pink dots indicate DEGs (Padj<0.05); blue dots indicate DEGs (Padj<0.05) above or below the set LFC threshold of +0.58 or −0.58, respectively. Genes with the 20 smallest Padj values, i.e. those with a statistically most-significant differential expression, are named.

