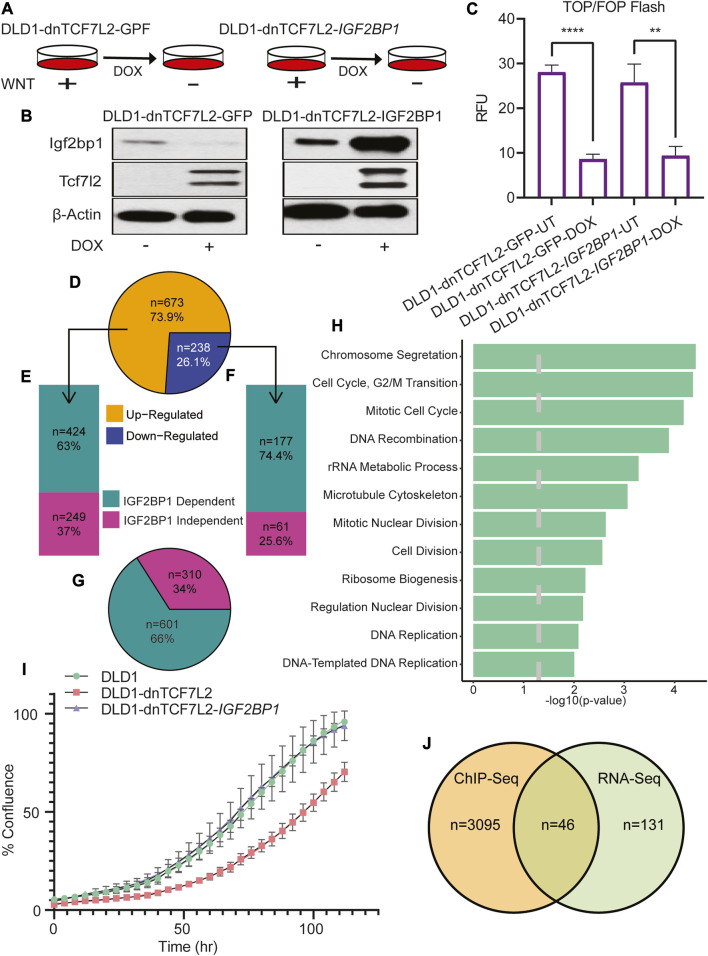
FIGURE 1.
Global role of IGF2BP1 in Wnt/β-catenin-regulated genes in CRC cells. (A) Pictorial diagram illustrating the experimental setup: DLD1 cells were transformed and treated with doxycycline to induce the expression of dnTcf7L2 and GFP in DLD1-dnTCF7L2-GFP cells, and dnTcf7L2 and Igf2bp1 in DLD1-dnTCF7L2-IGF2BP1 cells. (B) Immunoblot assay showing the expression levels of Tcf7L2 and Igf2bp1 after doxycycline treatment. β-actin levels were used as a loading control. (C) TOP/FOP-Flash assay indicating the extent of Wnt signaling inhibition upon induction of dnTcf7L2 and GFP in DLD1-dnTCF7L2-GFP cells, and dnTcf7L2 and Igf2bp1 in DLD1-dnTCF7L2-IGF2BP1 cells. Data are presented as means ± SD (n = 3). (D) Pie chart displaying differentially expressed genes upon Wnt signaling inhibition in DLD1-dnTCF7L2-GFP cells. (E) Bar plot illustrating IGF2BP1-dependent/independent genes in DLD1-dnTCF7L2-IGF2BP1 cells that were upregulated in DLD1-dnTCF7L2-GFP. (F) Bar plot depicting IGF2BP1-dependent/independent genes in DLD1-dnTCF7L2-IGF2BP1 cells that were downregulated in DLD1-dnTCF7L2-GFP. (G) Pie chart showing the total number of IGF2BP1-dependent and independent genes regulated by Wnt signaling. (H) Gene ontology analysis of subgroup of 177 downregulated genes (F) regulated by Wnt signaling and controlled by IGF2BP1.(I) Proliferation measured as % confluence of DLD1, DLD1-dnTCF7L2, and DLD1-dnTCF7L2-IGF2BP1 using the Incucyte Live-Cell Analysis System. (J) Venn diagram illustrating the overlapping genes between 177 Wnt target genes (F) regulated by IGF2BP1 and TCF7L2-ChIP-seq genes (reported in a published article).

