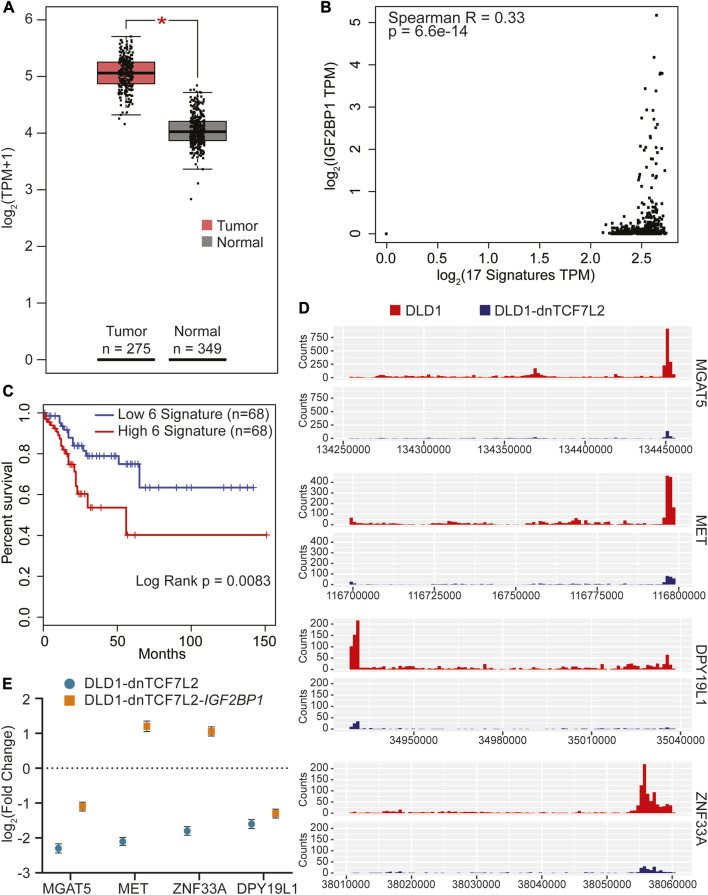
FIGURE 4.
Identification of gene signature in CRC regulated by both IGF2BP1 and Wnt signaling. (A) The 17 overlapping genes from Figure 2F were collectively analyzed using GEPIA2 to assess their RNA expression in tumor versus normal tissue of the COAD dataset. (B) Spearman correlation analysis was conducted between IGF2BP1 and the 17 signature genes expressed in the COAD dataset using the GEPIA2 platform. (C) Kaplan-Meier curves were plotted to evaluate the disease-free survival of COAD patients expressing the 5-gene signature in conjunction with IGF2BP1, using quartile group cutoff (analysis performed using GEPIA2). (D) Read density tracks display the read density for IGF2BP1 in two different conditions: Wnt-active (DLD1-GFP) and Wnt-suppressed (DLD1-dnTCF7L2), spanning the 3′UTR+CDS regions of MGAT5, MET, DPY19L1, and ZNF33A. (E) Gene expression profiles of MGAT5, MET, DPY19L1, and ZNF33A in doxycycline-treated versus untreated conditions in DLD1-dnTCF7L2-GFP and DLD1-dnTCF7L2-IGF2BP1 cells. Data are presented as means ± SD (n = 3).

