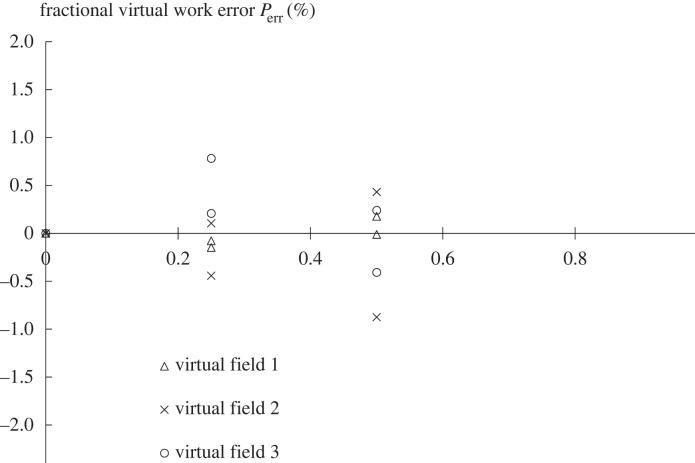
Figure 6.
The effect of adding synthetic noise to the displacement data. The graph shows the values of the error function Perr plotted against the RMS noise level for each of the three virtual fields; this was repeated twice so that there are two sets of points. It is evident that there was no systematic bias in the error function as a result of adding noise and that the three virtual fields were affected independently and differently.

