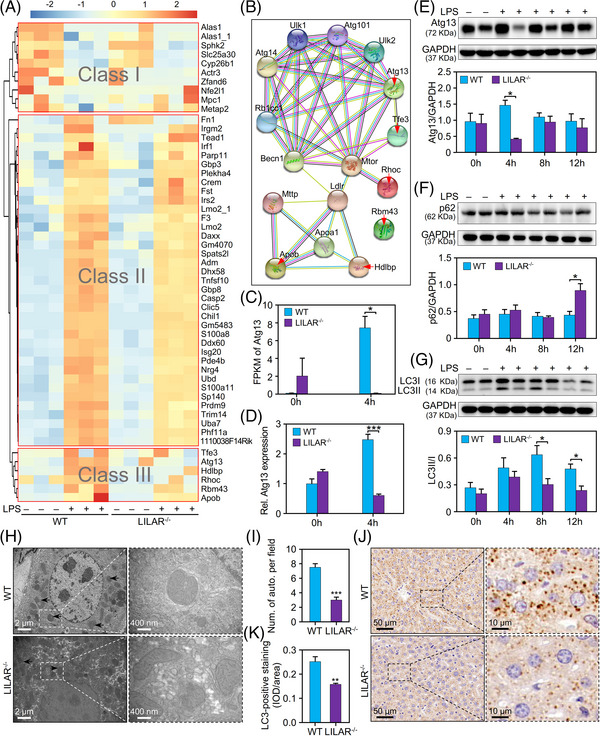
FIGURE 4.

LILAR deficiency reduces lipopolysaccharide (LPS)‐induced autophagy in liver tissues by downregulating autophagy‐related protein 13 (Atg13) expression. RNA‐sequencing (RNA‐seq) analysis was performed using livers from wild‐type (WT) and knockout (KO) (LILAR −/−) mice (n = 3/group) treated without or with LPS for 4 h. (A) Heatmap and clustering analysis of the differentially expressed genes. All the differentially expressed genes (DEGs) were clustered into Classes I, II, and III. (B) STRING analysis of gene products from Class III by setting the first shell with no more than 10 interactors. The genes from Class III are indicated by red arrows. (C) Quantitation of Atg13 mRNA by FPKM values from RNA‐seq data. (D) Quantitation of Atg13 mRNA expression by quantitative real‐time polymerase chain reaction (qRT‐PCR). n = 3/group. (E–G) Western blot analysis of Atg13 (E), p62 (F), and LC3B (G) protein expression in the liver tissues of WT and LILAR −/− mice treated without or with LPS (20 mg/kg) for 4, 8, and 12 h. n ≥ 3/group. (H) Electron microscopy examination of autophagy structures in liver tissues from WT and LILAR −/− mice treated with LPS for 12 h. The autophagosome was indicated by the black arrow. (I) The histogram displaying the number of autophagosomes per field. n = 4/group. (J) Immunohistochemistry staining of LC3B in the liver tissues from WT mice and LILAR −/− mice treated with LPS for 12 h. (K) Quantitative analysis of the level of LC3B by immunohistochemical staining (n = 6/group). IOD, integrated optical density. * p < 0.05; ** p < 0.01; *** p < 0.001.
