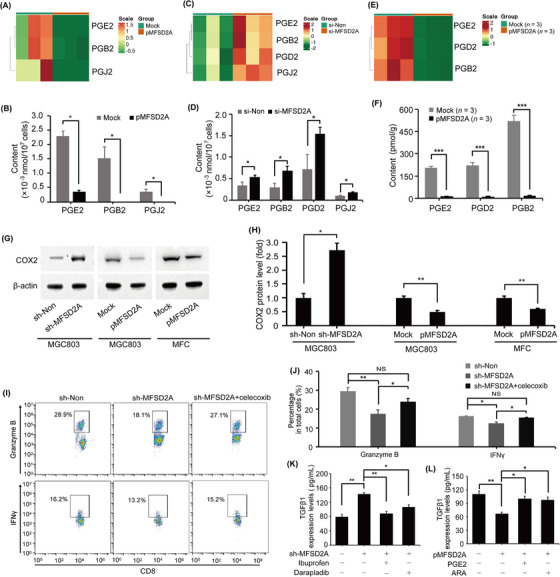
FIGURE 6.

MFSD2A promotes T cell activation by restricting COX2‐prostaglandin‐TGFβ1 axis. (A‐D) Heatmaps and quantification of indicated prostaglandins in MFSD2A‐overexpressed (A and B) and MFSD2A‐silenced (C and D) MGC803 cells compared with control cells analyzed by lipid metabolomics. (E‐F) Heatmaps (E) and quantification of indicated prostaglandins (F) from MFSD2A‐overexpressed or control MFC tumor tissues analyzed by lipid metabolomics. (G‐H) COX2 expression in MFSD2A‐silenced MGC803 cells, MFSD2A‐overexpressed MGC803 cells, MFSD2A‐overexpressed MFC cells and control cells was detected by Western blotting. (I‐J) Flow cytometry analysis of the expression of granzyme B and IFNγ in CD8+ T cells after co‐cultured with MFSD2A‐silenced or control MGC803 cells pretreated with celecoxib (50 μmol/L). (K) TGFβ1 production was examined by ELISA in MFSD2A‐silenced MGC803 cells pretreated with COX2 inhibitor ibuprofen or Lp‐PLA2 inhibitor darapladib. (L) TGFβ1 production was examined by ELISA in MFSD2A‐overexpressed MGC803 cells pretreated with prostaglandin E2 or arachidonic acid. All values are presented as the mean ± SEM. * P < 0.05, ** P < 0.01, *** P < 0.001. Abbreviations: MFSD2A, Major Facilitator Superfamily Domain Containing 2A; TGFβ1, transforming growth factor‐beta 1; COX2, cyclooxygenase 2; Lp‐PLA2, lipoprotein‐associated phospholipase A2; ELISA, enzyme‐linked immunosorbent assay; PGE2, prostaglandin E2; ARA, arachidonic acid; SEM, standard error of the mean.
