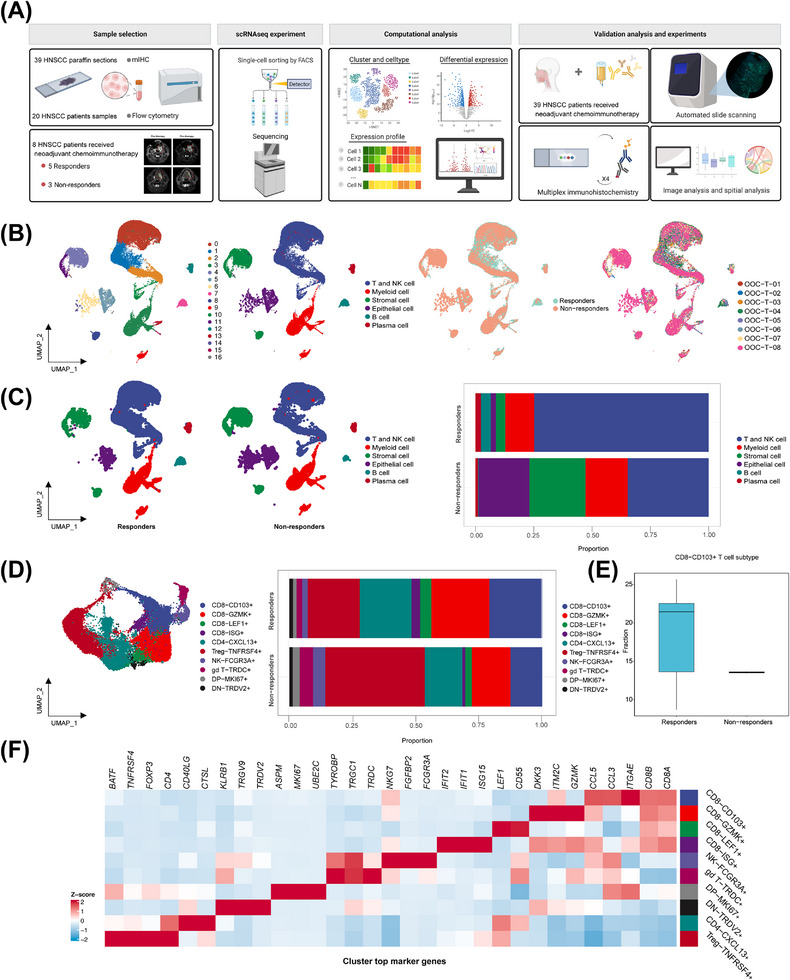
FIGURE 1.

Immune cell profile of advanced HNSCC at single‐cell atlas. (A) Schematic overview of the experimental design and analytical workflow. We performed combined scRNA‐seq and mIHC staining with tumor samples derived from NACI‐treated HNSCC patients to identify CD103+CD8+ TILs, associated with clinical response. (B) A total of 17 mega‐clusters in advanced HNSCC. The clusters are visualized and labeled by cell type via UMAP visualization. The distributions of cell clusters between the responders and non‐responders are visualized by UMAP visualization. The distributions of cell clusters from 8 tumor samples are visualized respectively by UMAP visualization. (C) All cell type clusters are visualized via UMAP visualization in the responders versus non‐responders. Boxplots showing the alterations of cell clusters between the responders and non‐responders. (D) UMAP visualization of T and NK cell subclusters. The clusters are visualized and labeled by cell type. The bar graph represents the proportion of these subclusters in responders and non‐responders. (E) The bar graph represents the proportion of CD103+CD8+ T cells in the T cell expression between the responders and non‐responders. (F) Heatmap depicting the cell‐type‐specific markers in the T and NK cell subclusters of scRNA‐seq analysis. Abbreviations: HNSCC, head and neck squamous cell carcinoma; scRNA‐seq, single‐cell RNA sequencing; NK, natural killer; GZMK, Granzyme K; LEF1, lymphoid enhancer binding factor 1; ISG, interferon stimulated exonuclease gene; TNFRSF4, TNF receptor superfamily member 4; CXCL13, C‐X‐C motif chemokine ligand 13; FCGR3A, Fc gamma receptor IIIa; TRDC, T cell receptor delta constant; MKI67, Marker of proliferation Ki‐67; TRDV2, T cell receptor delta variable 2.
