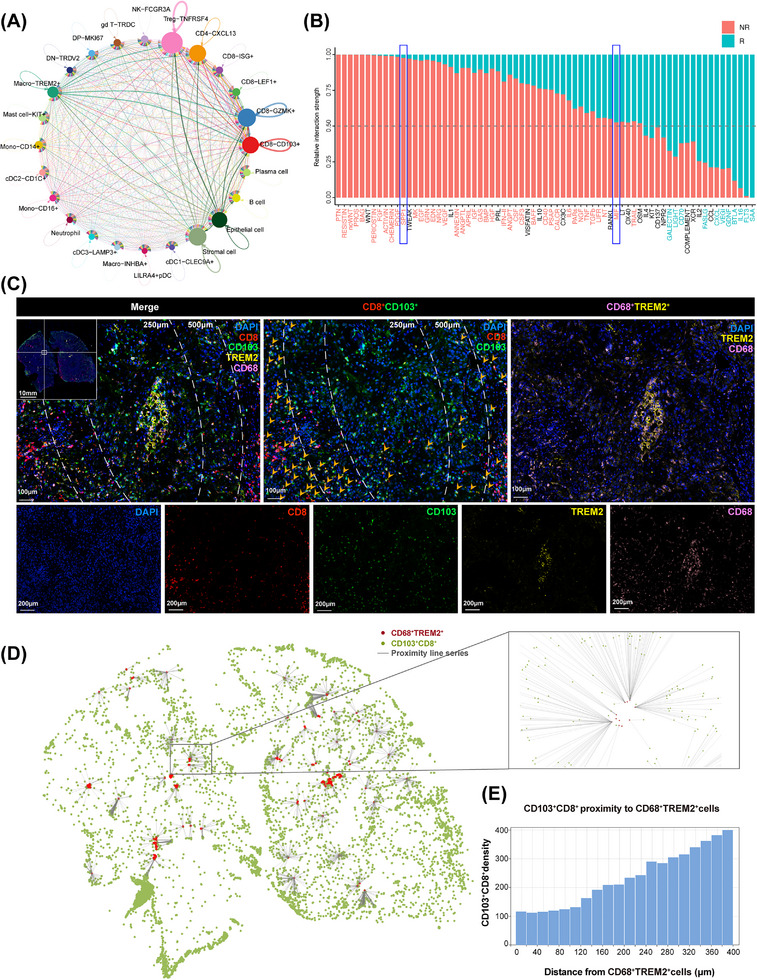
FIGURE 6.

Correlation between CD103+CD8+ TILs and TREM2+ macrophages. (A) Correlative network showing interactions of cell subsets identified in advanced HNSCC tissues based on scRNA‐seq. The arrow width indicates the degree of correlation between two clusters. (B) Bar plot shows the relative proportion of interaction strength for each signaling pathway between responders and non‐responders. The pathways labeled blue are enriched in responders, and labeled red are enriched in non‐responders. R: responders; NR: non‐responders. (C) mIHC staining of TREM2+ macrophages marker CD68 (pink) and TREM2 (yellow), and CD103+CD8+ TILs marker CD103 (green) and CD8 (red), and DAPI staining (blue) in the advanced HNSCC with NACI. Scale bars, 100 μm. Quantification of CD103+CD8+ TILs at a distance of 250 μm or 500 μm from TREM2+ macrophages. (D) Proximity line series between CD103+CD8+ TILs and TREM2+ macrophages. (E) Proximity analysis histograms of CD103+CD8+ TILs to TREM2+ macrophages within a 400 μm radius by progressive segments of 20 μm bands. Abbreviations: TIL, tumor‐infiltrating cell; HNSCC, head and neck squamous cell carcinoma; mIHC, multiplex immunofluorescent; TREM2, triggering receptor expressed on myeloid cells 2; R, responders; NR, non‐responders; NACI, neoadjuvant chemoimmunotherapy; scRNA‐seq, single‐cell RNA sequencing.
