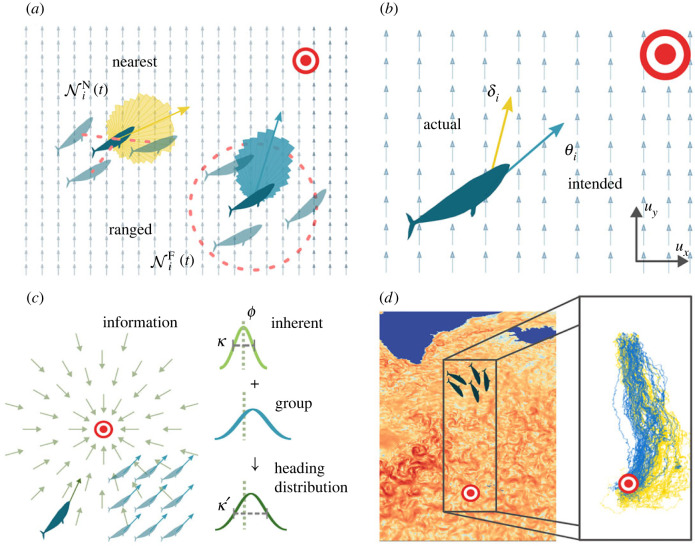
Figure 1.
Model summary. (a) Interacting with nearest neighbours (), as opposed to a fixed radius interaction, (), changes the potential heading distributions (coloured rose plots). Interaction is shown using a red dashed line. (b) An individual’s intended heading θi (blue) can differ from their actual heading δi (yellow) in a flowing environment when navigating towards a target (red/white). Light blue arrows indicate the background flow direction. (c) Information is gathered from the environment and neighbours to form a heading distribution for sampling during reorientation. Light green lines indicate the goal direction. (d) Ocean flow data from the North Atlantic and simulation region used in §3.3 with example trajectories navigating using the intended (blue) and actual (yellow) headings [29].

