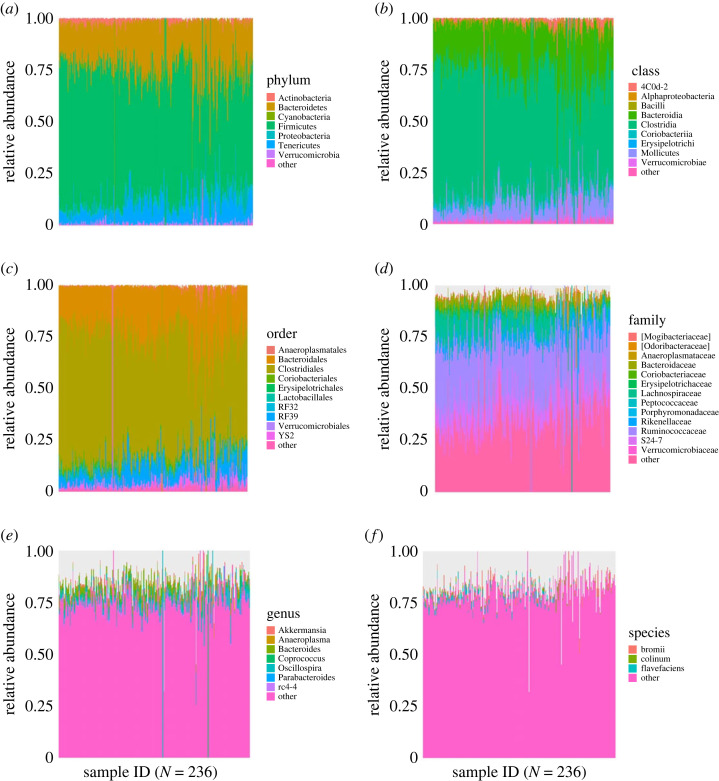
Figure 1.
The relative abundance distributions for all taxonomic levels, with sample ID indicating the number of samples and colours corresponding to differing microbial categorizations. The yellow bars accounted for ‘other' categorization. Resolution of microbial taxonomic assignment was reduced at lower taxonomic levels.

