
Fig. 7. 5-oxo-ETE–dependent activation of OXER1 polarizes HL-60 cells to an N2 phenotype, in part by suppressing the PPP.
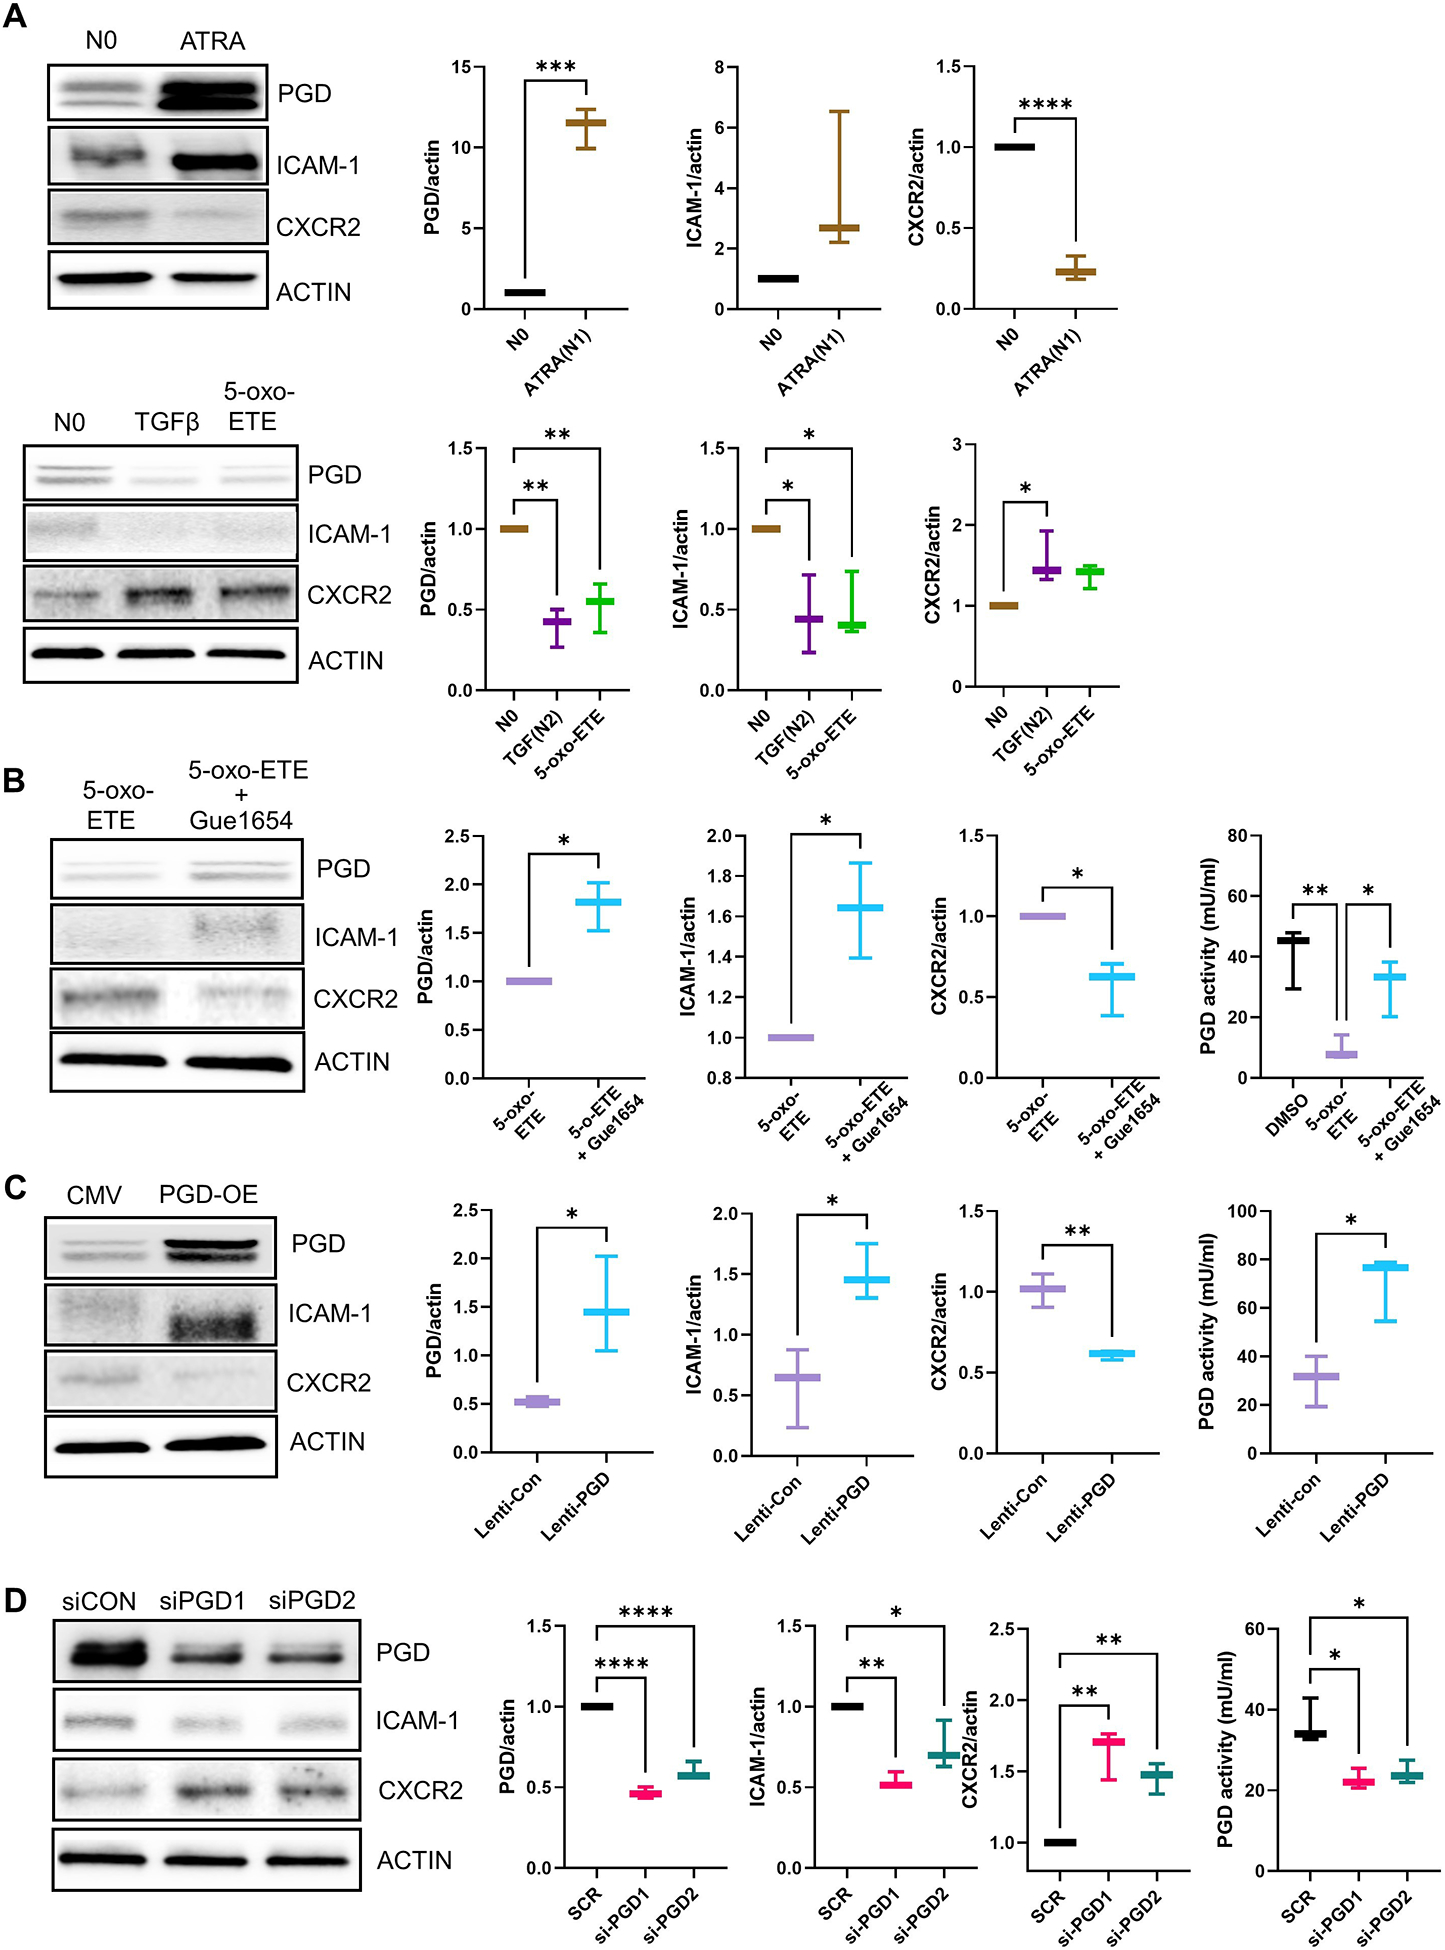
(A and B) HL-60 cells were treated with DMSO (no polarization, N0), the N1 polarization inducer all-trans retinoic acid (ATRA) for 3 days, the N2 polarization inducer TGFβ for 3 days, or with 5-oxo-ETE or 5-oxo-ETE plus Gue1654 for 12 hrs. Gue1654 was pre-treated for 30 min pior to the addition of 5-oxo-ETE for 12 hrs. Protein extracts were used for immunoblotting and quantification of PGD, the N1 marker ICAM-1, the N2 marker CXCR2, and β-actin (ACTIN). In (B), protein extracts were also used to measure PGD enzymatic activity. Data are displayed as boxplots (mean ± SD) analyzed by either unpaired t-test with Welch’s correction (graphs with two groups) or one-way ANOVA with Tukey’s multiple comparisons test (graph with three groups); *p<0.05, **p<0.01, n=3 to 4 biological replicates/group repeated on at least two separate occasions. (C and D) Lentiviral-mediated PGD overexpression (A) and siRNA-mediated PGD knockdown (B) in HL-60 cells. Cells were treated with high-titer control lentivirus (CMV), PGD lentivirus (PGD-OE), scrambled control siRNA (siCON), or PGD-targeting siRNAs (siPGD1 and siPGD2) for 48 hrs. Protein extracts were used for immunoblotting and quantification of PGD, ICAM-1, CXCR2, and β-actin and for PGD activity assays. Data for PGD enzymatic activity are displayed as boxplots (mean ± SD) and were analyzed by one-way ANOVA with Tukey’s multiple comparisons test; *p < 0.05, , n=4 (biological replicates/group) repeated on two separate occasions. Data for protein quantification are displayed as boxplots (mean ± SD) and were analyzed by one-way ANOVA with Tukey’s multiple comparisons test; *p<0.05, **p<0.01, ****p<0.0001, (p > 0.05), n=3 to 4 (biological replicates/group) repeated on two separate occasions.