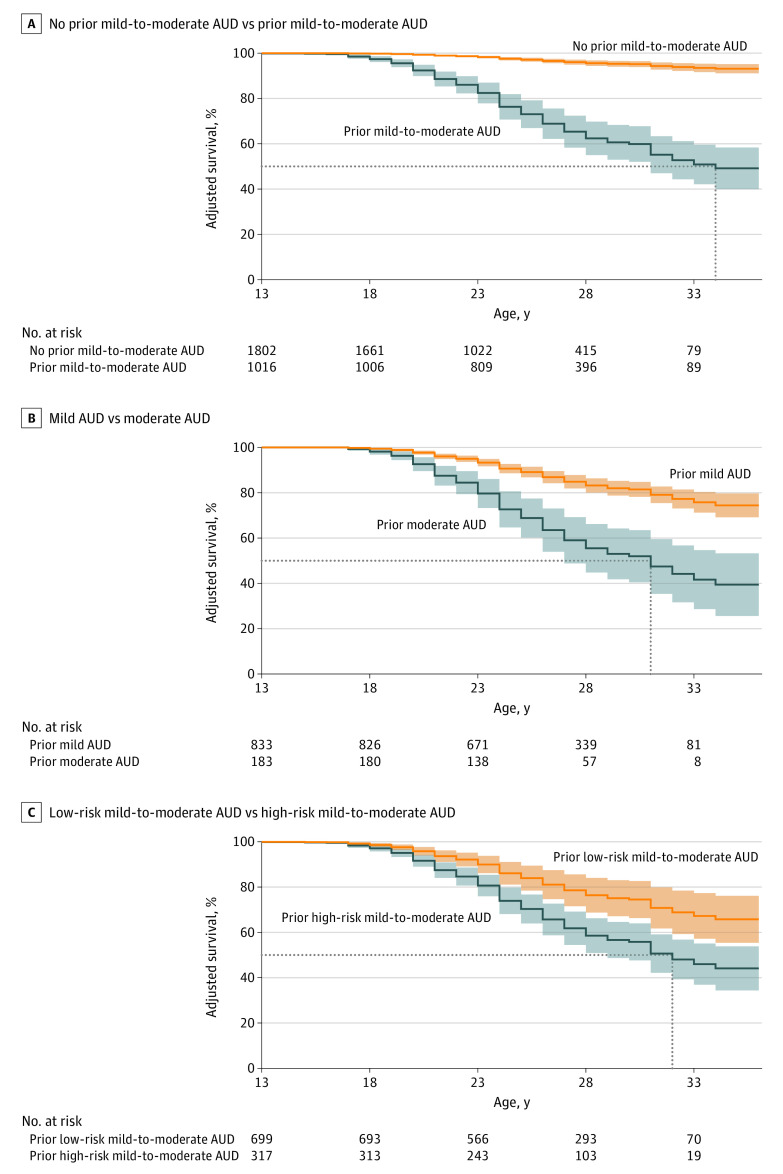
Figure 2. Longitudinal Collaborative Study on the Genetics of Alcoholism (COGA) Cohort (N = 2818) Survival Curves and 95% Confidence Intervals for Progression to Severe Alcohol Use Disorder (AUD).
All survival curves include no prior mild-to-moderate AUD as comparison and are adjusted for sex, race and ethnicity, and mild-to-moderate AUD criterion count. A, Survival curves additionally adjusted for endorsement of prior mild-to-moderate AUD. B, Survival curves additionally adjusted for mild vs moderate AUD. C, Survival curves additionally adjusted for low-risk vs high-risk mild-to-moderate AUD. Dotted lines represent point estimates of median survival ages (not accounting for 95% CIs): A, prior mild-to-moderate AUD = 34 years; B, mild AUD = undefined, moderate AUD = 31 years; C, low-risk mild-to-moderate AUD = undefined, high-risk mild-to-moderate AUD = 32 years.

