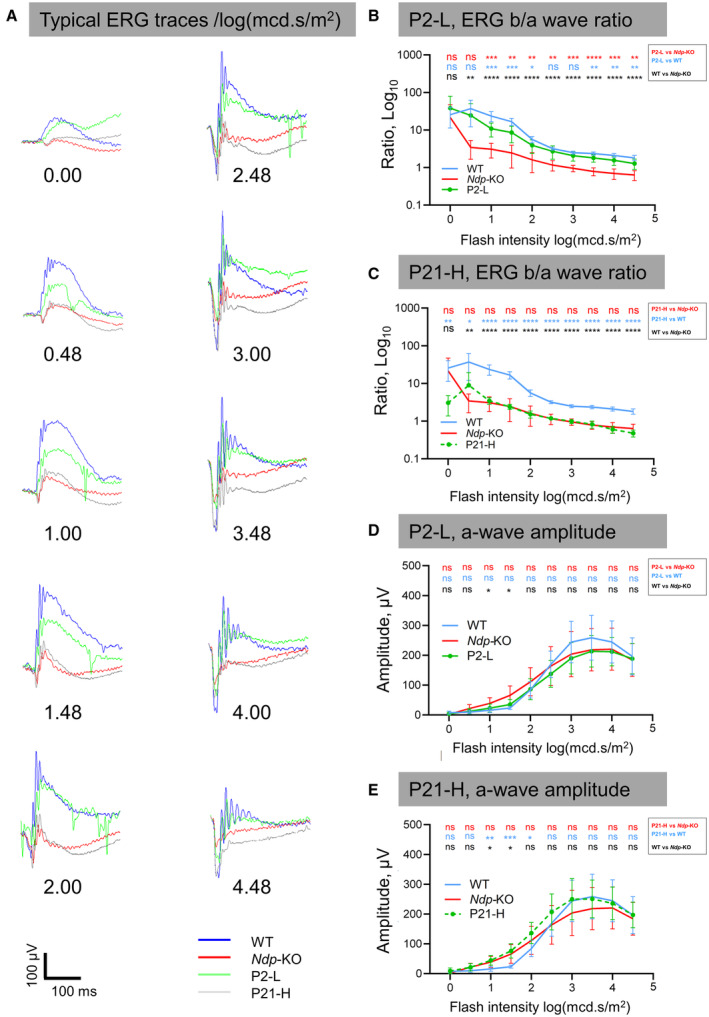
Figure EV3. Electroretinograms showing effects of early and late treatments.

-
ARepresentative ERG traces in response to flashes of light of increasing intensity (an average of 10 flashes shown for each trace).
-
B, CFlash ERG, ratio of b‐wave to a‐wave amplitude for P2‐L and P21‐H treatment groups.
-
D, EFlash ERG, a‐wave amplitudes for P2‐L and P21‐H treatment groups.
n = biological replicates. Data information: n (WT) = 10, n (Ndp‐KO) = 10, n (P2‐L) = 7, n (P21‐H) = 10. Data are shown as mean ± SD. Statistical analysis was performed by one‐way ANOVA with Sidak's post hoc test, comparing each treatment group with WT (blue asterisks) and Ndp‐KO (red asterisks), between WT and Ndp‐KO (black asterisks). Post hoc test values: *P ≤ 0.05, **P ≤ 0.01, ***P ≤ 0.001, ****P ≤ 0.0001: ns, not significant.
Source data are available online for this figure.
