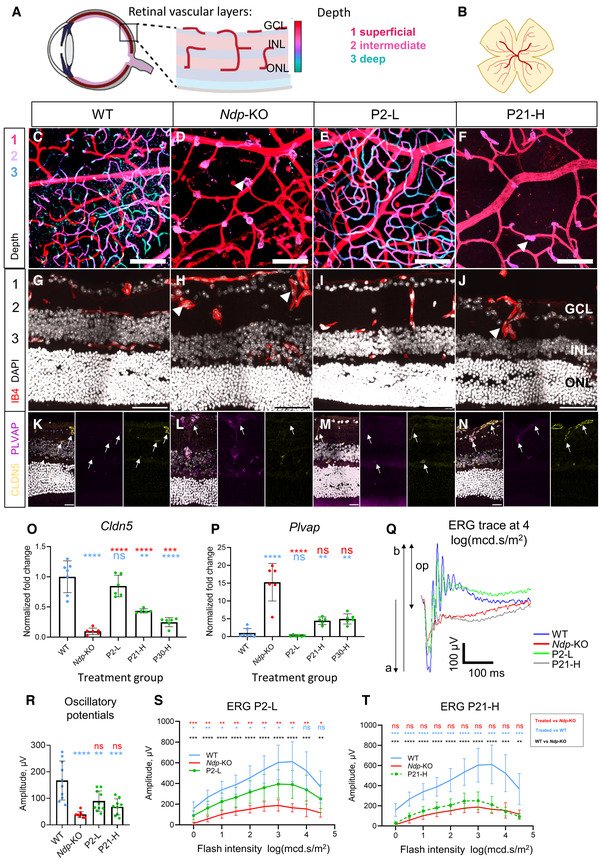
Figure 4. Effects of AAV9.NDP treatment on the retinal vessel morphology and visual function.

-
A, BSchematic of the normal retinal vasculature showing three vascular plexi in (A) cross‐sections and (B) whole mount, colour depth projection scheme indicated for (C–F).
-
C–FPseudocoloured depth projections of vascular plexi in the central retina of retinal whole mounts at 3 months. Vasculature staining with isolectin B4 (IB4) shows three plexi in the WT and after treatment at P2. C–F images are z‐projections of 50 slices of 0.75 μm. Treatment groups: C, WT; D, Ndp‐KO; E, P2‐L; F, P30‐H.
-
G–JVasculature: IB4, nuclei: DAPI at 2 months.
-
K–NLocalisation of tight junction marker claudin‐5 (CLDN5) and PLVAP at 2 months.
-
O, PqRT‐PCR analysis of pathology‐related genes (O) Cldn5 (P) Plvap in retina at 2 months. Data information: Genotype and treatment ages (WT, Ndp‐KO, P2‐L, P21‐L, P21‐H, P30‐H) indicated on x axes. Mean ± SD; n = biological replicates. Sample numbers: n (WT) = 7, n (Ndp‐KO) = 6, n (P2‐L) = 6, n (P21‐L) = 6, n (P21‐H) = 6, n (P30‐H) = 6. Statistical analysis: analysed with one‐way ANOVA with Sidak's post hoc test, all values compared to WT (blue asterisks) and Ndp‐KO (red asterisks).
-
Q–TEvaluation of visual function recovery with scotopic electroretinography (ERG) at 1.5 months of age. Example of ERG waves at 10 cd/s.m2 flash intensity stimulus in WT, Ndp‐KO, P2‐L and P21‐H groups, n = 1 (average of 10 repeated flashes; a‐wave, b‐wave, op—oscillatory potential) (Q). Oscillatory potentials (R), mean ERG b‐wave at increasing stimulus flash intensities in P2‐L (S) and P21‐H (T) groups compared with Ndp‐KO and WT. Data are shown as individual traces in (Q) and as mean ± SD in (R and T).
Data information: Sample numbers for C–N: n = 4 per each group. O, P, R analysed with one‐way ANOVA with Sidak's post hoc test, S‐T analysed with two‐way repeated measures ANOVA with Tukey's post hoc test; all values compared to respective WT (blue asterisks) and Ndp‐KO (red asterisks). Post hoc test values: *P ≤ 0.05, **P ≤ 0.01, ***P ≤ 0.001, ****P ≤ 0.0001; ns, non‐significant. Sample numbers for ERG analysis: n (WT) = 10, n (Ndp‐KO) = 10, n (P2‐L) = 7, n (P21‐H) = 10. n = biological replicates. GCL, ganglion cell layer; INL, inner nuclear layer; ONL, outer nuclear layer. Numbers 1, 2 and 3 label the superficial, intermediate and deep vascular plexuses. Arrows point to deep plexus vessels. Arrowheads point to abnormal neovascular tufts in Ndp‐KO and P21‐H. Scale bars: C–J 50 μm, K–N 20 μm. C–F and G–N images are z‐projections of 20 slices of 0.45 μm.
Source data are available online for this figure.
