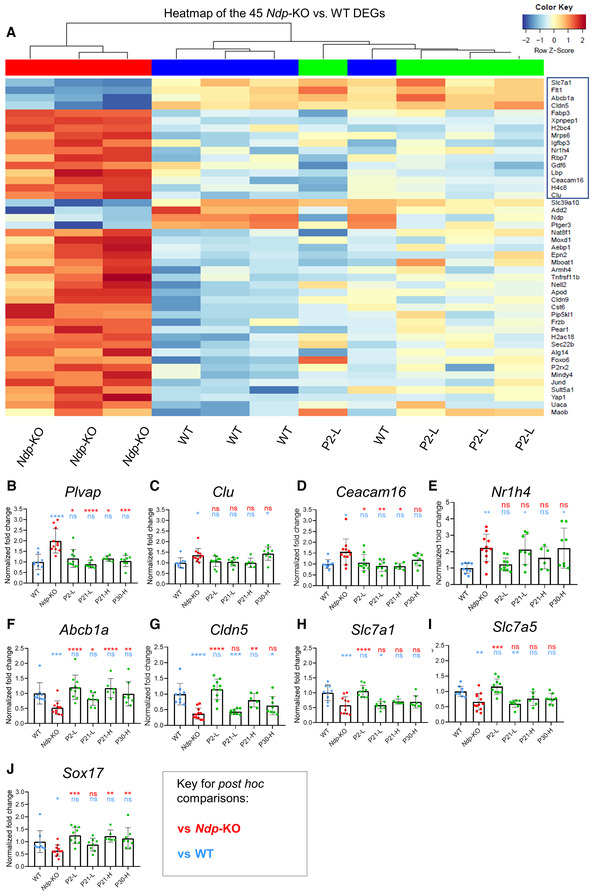
Figure 5. Preservation of gene expression in the cochlea by 2 months of age demonstrated by RNA‐seq and qRT‐PCR.

-
AHeatmap showing levels of expression of 45 pathology‐related DEGs identified between WT (blue) and Ndp‐KO (red) in WT, Ndp‐KO and P2‐L treated cochleas. Treatment restored expression to levels comparable to the WT (no significant difference in the WT versus P2‐L comparison for all 45 genes). Box indicates 16 genes significantly different in the P2‐L versus Ndp‐KO comparison.
-
B–JqRT‐PCR analysis of the expression of the pathology‐related biomarker genes in all treatment groups. Expression of pathology‐related genes (B) Plvap, (C) Clu, (D) Ceacam16, (E) Nr1h4, (F) Abcb1a, (G) Cldn5, (H) Slc7a1, (I) Slc7a5, (J) Sox17.
Data information: Genotype and treatment ages (WT, Ndp‐KO, P2‐L, P21‐L, P21‐H, P30‐H) indicated on x axes. B–E data are shown as mean ± SD; n = biological replicates. Sample numbers: n (WT) = 9, n (Ndp‐KO) = 12, n (P2‐L) = 10, n (P21‐L) = 8, n (P21‐H) = 6, n (P30‐H) = 8. Statistical analysis: B–J analysed with one‐way ANOVA with Sidak's post hoc test, all values compared to WT (blue asterisks) and Ndp‐KO (red asterisks). Post hoc test values: *P ≤ 0.05, **P ≤ 0.01, ***P ≤ 0.001, ****P ≤ 0.0001; ns, non‐significant.
Source data are available online for this figure.
