
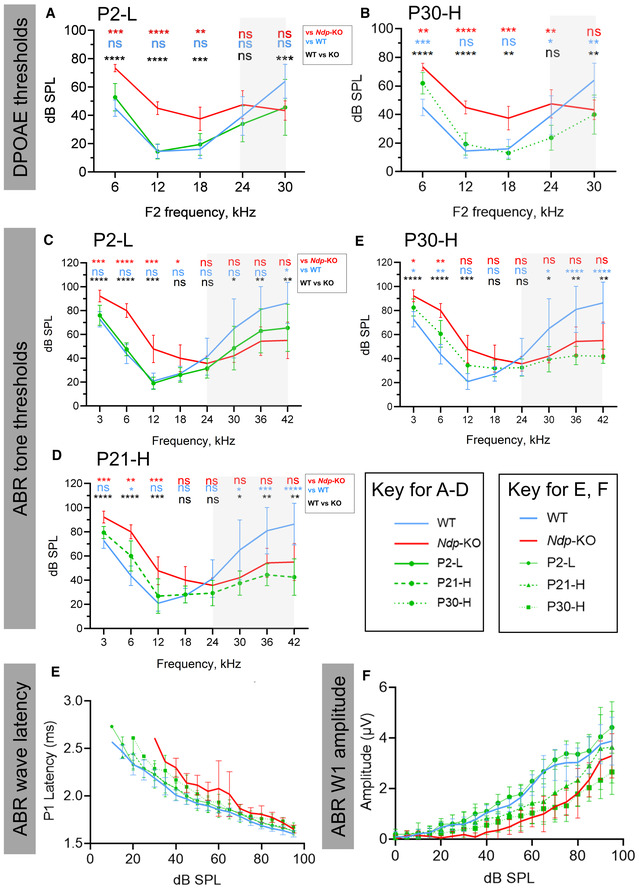
Figure EV5. Statistical analysis of auditory function analysis of DPOAE and ABR thresholds for all groups at 3 months.
-
A, BDPOAE thresholds of P2‐L, P30‐H and control groups. P values indicate statistically significant difference from WT (blue) and Ndp‐KO (red). n = biological replicates. n (WT) = 11, n (Ndp‐KO) = 6, n (P2‐L) = 9, n (P30‐H) = 8.
-
C–EABR thresholds of P2‐L, P‐30H and control groups. P values (blue) indicate statistically significant difference from WT. n = biological replicates. n (WT) = 12, n (Ndp‐KO) = 7, n (P2‐L) = 10, n (P21‐H) = 8, n (P30‐H) = 8.
-
EABR wave latency for each treatment group compared to Ndp‐KO and WT. n = biological replicates. n (WT) = 12, n (Ndp‐KO) = 7, n (P2‐L) = 10, n (P21‐H) = 8, n (P30‐H) = 8.
-
FABR wave 1 amplitude for each treatment group compared to Ndp‐KO and WT. n = biological replicates. n (WT) = 12, n (Ndp‐KO) = 7, n (P2‐L) = 10, n (P21‐H) = 8, n (P30‐H) = 8.
Data information: Data are shown as mean ± SD. Statistical analysis was performed by two‐way repeated measures ANOVA with Tukey's post hoc test, comparing each treatment group with WT (blue asterisks) and Ndp‐KO (red asterisks), and comparing between WT and Ndp‐KO (black asterisks). Post hoc test values: *P ≤ 0.05, **P ≤ 0.01, ***P ≤ 0.001, ****P ≤ 0.0001.
Source data are available online for this figure.