
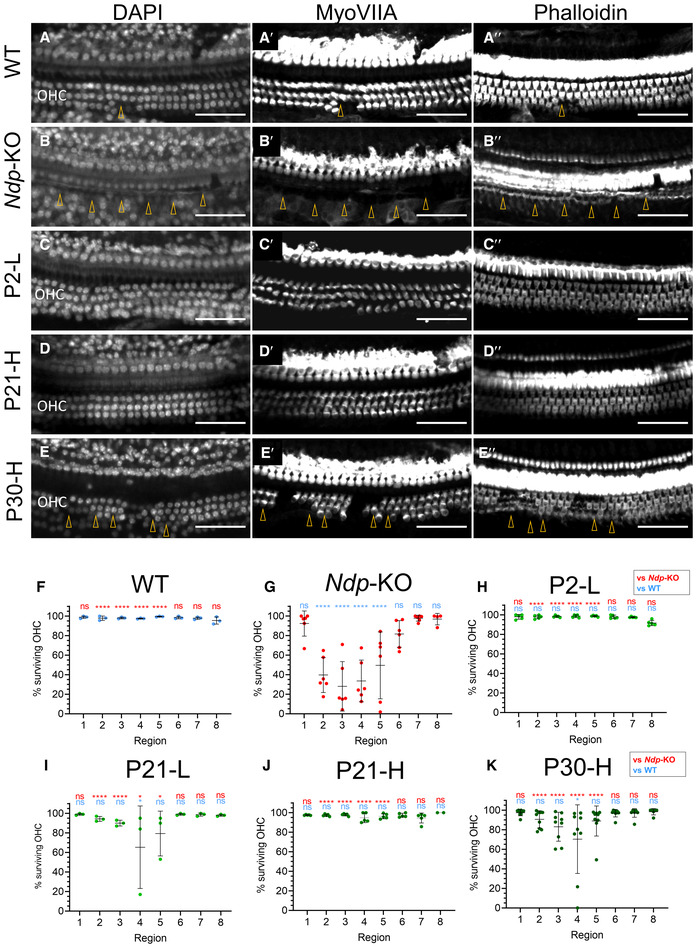
Figure 7. Preservation of the outer hair cells in all treatment groups by 2 months.
-
A–EExamples of hair cell survival in matching “sensitive” region 2/8 corresponding to 6.1–10 kHz along the tonotopic axis from different treatment groups. A–E: DAPI, A′‐E′: MyoVIIA immunostaining, A″‐E″: phalloidin. (A) WT, n = 7; (B) Ndp‐KO, n = 6; (C) P2‐L, n = 5; (D) P21‐H, n = 6; (E) P30‐H, n = 8. Arrowheads indicate site of hair cell loss, OHC, outer hair cell. Scale bar 50 μm.
-
F–KQuantification of the surviving hair cells from the same samples groups as in A–E. Regions of the organ of Corti defined as fractional distance from the apex (1/8 to 8/8): region 1 (3.1–6.1 kHz), region 2 (6.1–10.0 kHz), region 3 (10.0–15.0 kHz), region 4 (15.0–21.6 kHz), region 5 (21.6–30.2 kHz), region 6 (30.2–41.3 kHz), region 7 (41.3–55.9 kHz), region 8 (55.9–74.8 kHz). Analysed with two‐way repeated measures ANOVA with Tukey's post hoc test, samples compared to the WT (blue asterisks) and Ndp‐KO (red asterisks). n = biological replicates. (F) WT, n = 3; (G) Ndp‐KO, n = 6; (H) P2‐L, n = 5; (I) P21‐L, n = 3; (J) P21‐H, n = 6; (K) P30‐H, n = 8.
Data information: Quantification data are shown as mean ± SD. Significant effects of region (P < 0.0001), treatment group (P < 0.0001) and their interaction (P < 0.0001). Post hoc test values: *P ≤ 0.05, **P ≤ 0.01, ***P ≤ 0.001, ****P ≤ 0.0001; ns, non‐significant.
Source data are available online for this figure.