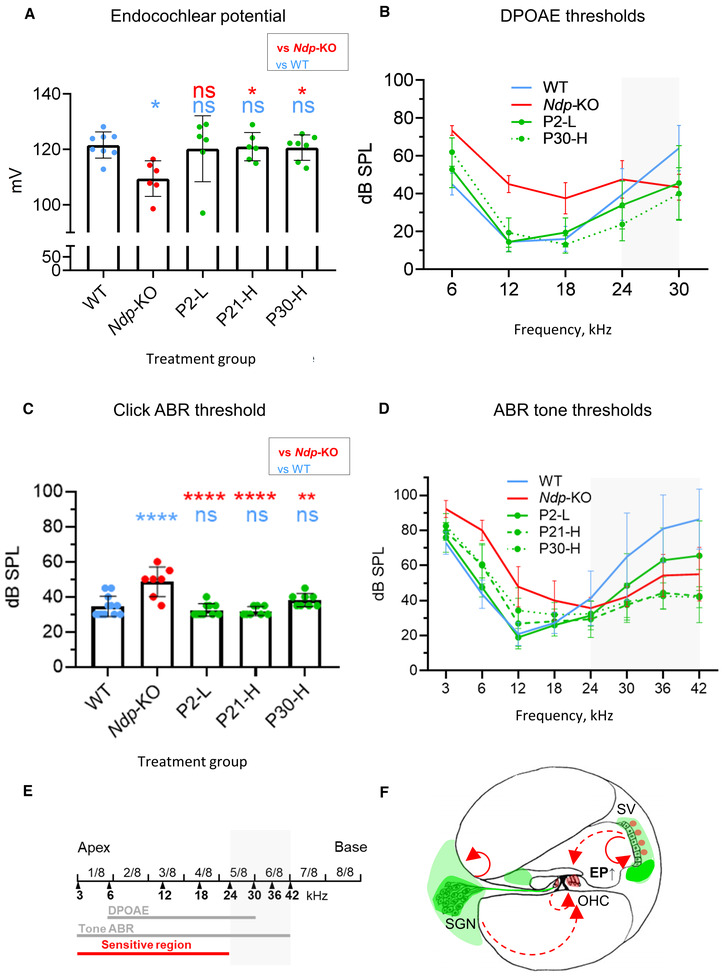
Figure 8. Auditory function at 3 months.

- Endocochlear potentials (mean ± SD) analysed with one‐way ANOVA with Sidak's post hoc test, each treatment group compared to the WT (blue asterisks) and Ndp‐KO (red asterisks). *P (Ndp‐KO vs. WT) = 0.0107.
- Overlay of DPOAE thresholds (mean ± SD). Grey area marks high‐frequency region affected in the WT. Statistical analysis for (B) is provided in Fig EV7.
- Click ABR thresholds (mean ± SD) analysed with one‐way ANOVA with Sidak's post hoc test, each group compared to WT (blue asterisks) and Ndp‐KO (red asterisks).
- Overlay of pure tone ABR thresholds from control and treatment groups (mean ± SD). Grey area marks region affected in the WT. Statistical analysis for (D) is provided in Fig EV7.
- Schematic of tonotopic region correspondence with auditory function measures. The whole length of the cochlea is divided in eight equal length regions (1/8–8/8). Black arrowheads mark the respective frequencies (kHz), to which specific points correspond. Red line indicates the tonotopic region, sensitive to degeneration in the Ndp‐KO. Grey lines indicate frequency regions, in which the ABR and DPOAE were recorded. Grey area marks region affected in the WT by age‐related degeneration.
- Schematic of the putative Norrie phenotype rescue mechanism by gene therapy. Green colour labels the areas typically transduced in all treatment groups, and red arrows indicate the putative targeting sites of the NDP, produced in and secreted from the transduced areas (green). SV, stria vascularis; SGN, spiral ganglion; OHC, outer hair cell; EP, endocochlear potential.
Data information: Data are shown as mean ± SD. Animal numbers for auditory function analyses: n = biological replicates. Endocochlear potential: n (WT) = 8, n (Ndp‐KO) = 6, n (P2‐L) = 6, n (P21‐H) = 6, n (P30‐H) = 7. DPOAE: n (WT) = 11, n (Ndp‐KO) = 6, n (P2‐L) = 9, n (P30‐H) = 8. Click and pure tone ABR: n (WT) = 12, n (Ndp‐KO) = 7, n (P2‐L) = 10, n (P21‐H) = 8, n (P30‐H) = 8. Post hoc test values: *P ≤ 0.05, **P ≤ 0.01, ***P ≤ 0.001, ****P ≤ 0.0001; ns, non‐significant.
Source data are available online for this figure.
