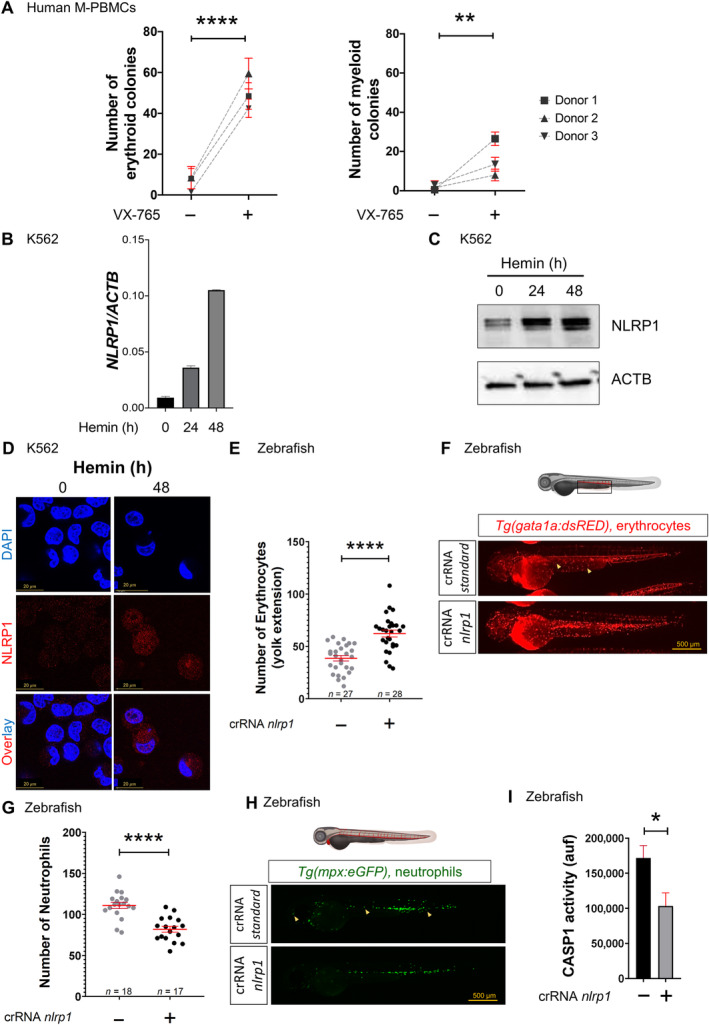
Figure 1. NLRP1 inflammasome regulates hematopoiesis.

-
ANumber of erythroid and myeloid colonies derived from M‐PBMCs obtained from healthy donors in the presence of DMSO or 100 μM VX‐765. Each symbol represents a different donor.
-
B–DTranscript (B) and protein (C, D) amounts of NLRP1 in K562 cells after differentiation with 50 μM hemin, assayed by RT–qPCR (B), Western blot (C) and immunofluorescence (D). Nuclei were counterstained with DAPI in D. Data are shown as the means ± SEM of three technical replicates in B.
-
E–INumber of erythrocytes (E, F) and neutrophils (G, H), and caspase‐1 activity (I) in nlrp1 crispant larvae of 2 dpf obtained by injecting one‐cell stage embryos with standard or nlrp1 crRNAs/Cas9 complexes. Representative images are shown in (F) and (H). Each dot represents one individual and the mean ± SEM for each group is also shown in (E) and (G). Data are shown as the means ± SEM of four technical replicates in I. P values were calculated using Student's t‐test. *P < 0.05; **P < 0.01; ****P < 0.0001.
Source data are available online for this figure.
