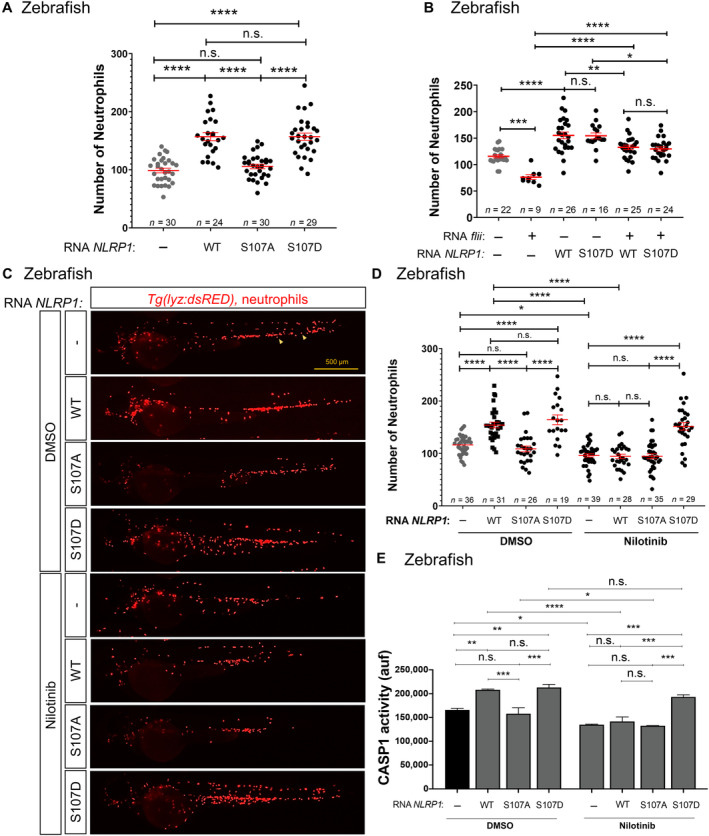
Figure 8. NLRP1 is activated by phosphorylation of the linker domain after activation of ZAKα.

-
A–ENumber of neutrophils (A–D), and caspase‐1 activity (E) in 2 dpf larvae obtained by injection of one‐cell stage embryos with human NLRP1 (wild type‐WT, S107A and S107D) and treated from 1 to 2 dpf by bath immersion with 1 μM nilotinib (D, E). Representative images of neutrophils (arrows) are also shown in (C). Each dot represents one individual and the mean ± SEM for each group is also shown. Data are shown as the means ± SEM of two technical replicates in (E). P values were calculated by one‐way ANOVA and Tukey's multiple range test. n.s., non‐significant; *P < 0.05; **P < 0.01; ***P < 0.001; ****P < 0.0001.
Source data are available online for this figure.
