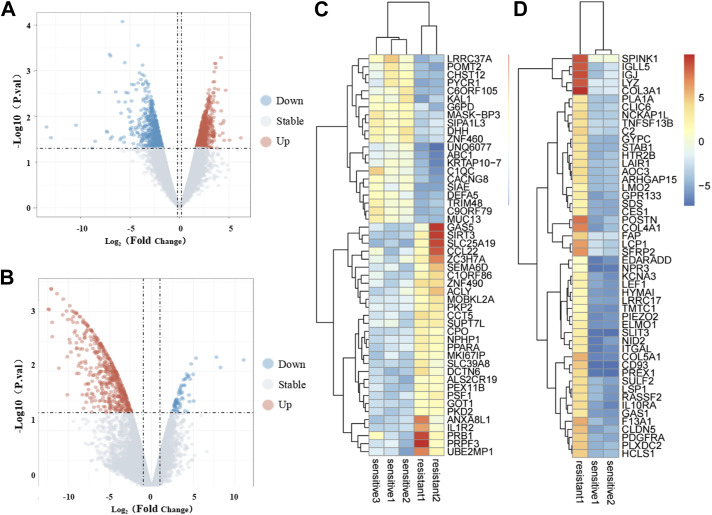
Figure 1. Identification of differentially expressed genes.
(A, B) Volcano plot of DEGs in the GSE64472 and GSE130160 datasets. The red dots represent up-regulated genes, the green dots represent down-regulated genes, and the black dots represent genes with no significant difference in expression. (C, D) Heatmap of the top 50 DEGs in the GSE64472 and GSE130160 datasets. Red represents up-regulated genes, and blue represents down-regulated genes.

