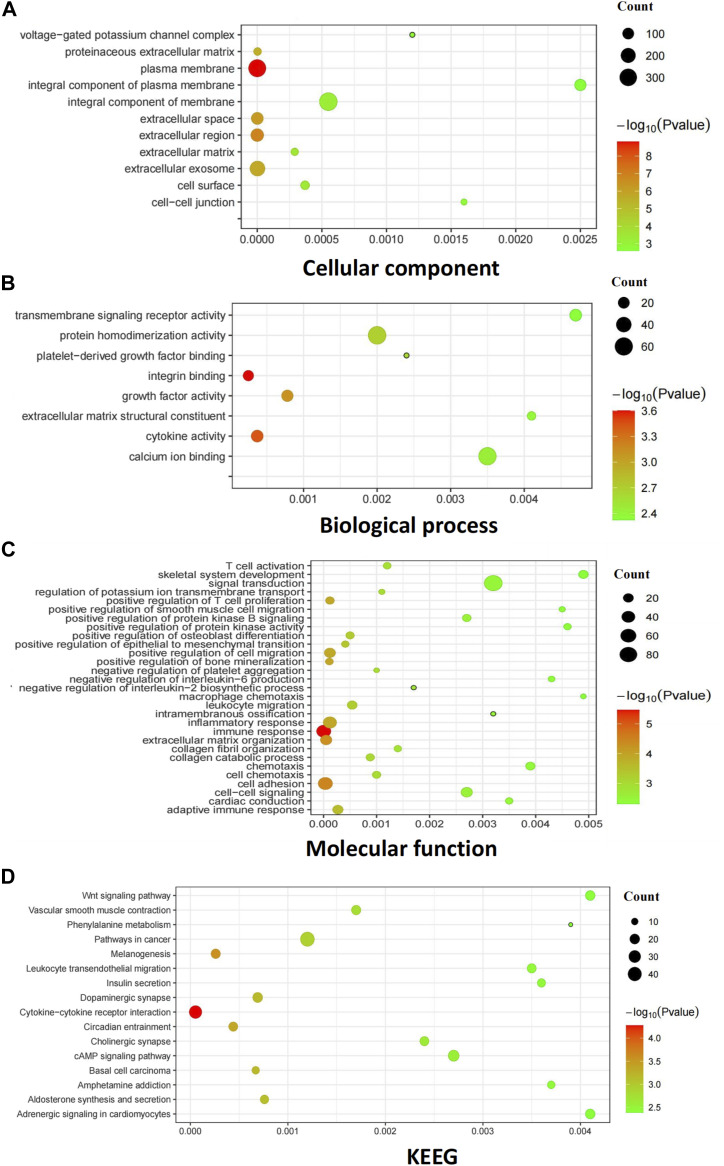
Figure 2. Gene Ontology and KEGG pathway analysis of DEGs in NSCLC.
(A) GO covering the domains of molecular functions (MF). (B) GO covering the domains of biological processes (BP). (C) GO covering the domains of cellular components (CC). (D) KEGG pathways that were the most significantly up-regulated pathways during SCLC. The bubbles represent the enrichment pathway with P-values < 0.05. The bubble size represents the number of enriched target genes in the process. The bubble color represents −log10 (P-value); from green to red, the P-value decreases. The Y-axis represents the enrichment target of GO or pathway. The X-axis is the RichFactor: its counts divided by the third column.

