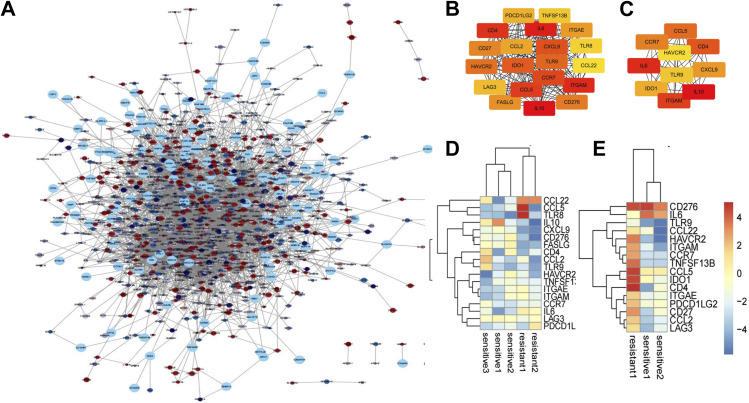
Figure 3. PPI analysis of DEGs based on Cytoscape.
(A) Visualized PPI analysis of DEGs. (B) Top 20 genes with the highest MCC scores in DEGs. (C) Top 10 genes with the highest MCC scores in DEGs; a darker color represents higher MCC scores. (D) Heatmap of the top 20 DEGs in GSE64472. (E) Heatmap of the top 20 DEGs in GSE130160. Red represents up-regulated genes, and blue represents down-regulated genes.

