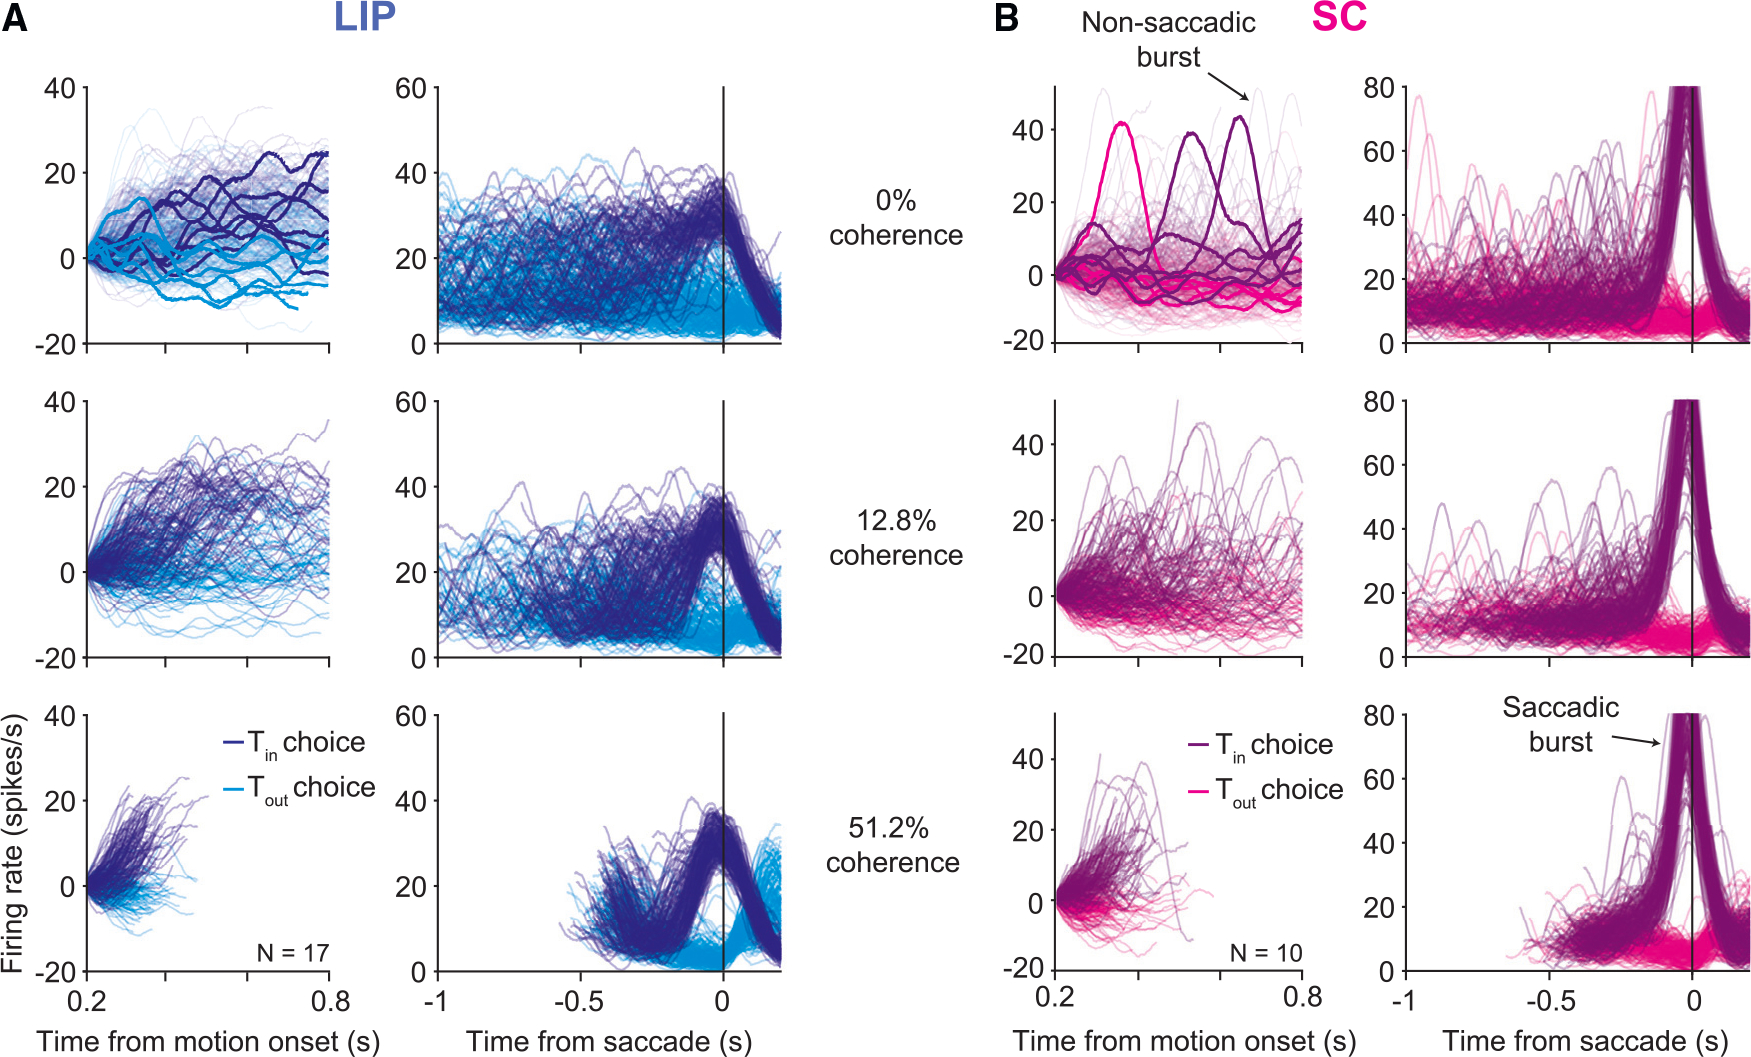
Figure 3. Single-trial dynamics in LIP and SC are different.

(A) Single-trial activity in LIP from an example session (1,797 trials). Each trace depicts the firing rate average of 17 LIP neurons on a single trial, smoothed by a Gaussian filter (σ = 25 ms), for three motion strengths (rows). The line color indicates the animal’s choice on that trial. Both correct and error trials are included. Left column: activity aligned to the onset of decision-related activity, ~200 ms from motion onset, until 100 ms before the saccade or 800 ms after motion onset (whichever occurs first). The rates are offset by the mean firing rate 0.18 s–0.2 s after motion onset in order to force all traces to begin at zero. In the top panel, a few representative trials are highlighted for clarity. Right column: the same trials are shown aligned to saccade initiation, without baseline offset. Note the different ordinate scales.
(B) Same as in (A) but for 10 SC neurons (1,696 trials). Two types of bursts were identified in SC: saccadic bursts occurred at the end of the decision, just before the saccade, and non-saccadic bursts occurred on ~10% of trials at random times while the decision was ongoing.
