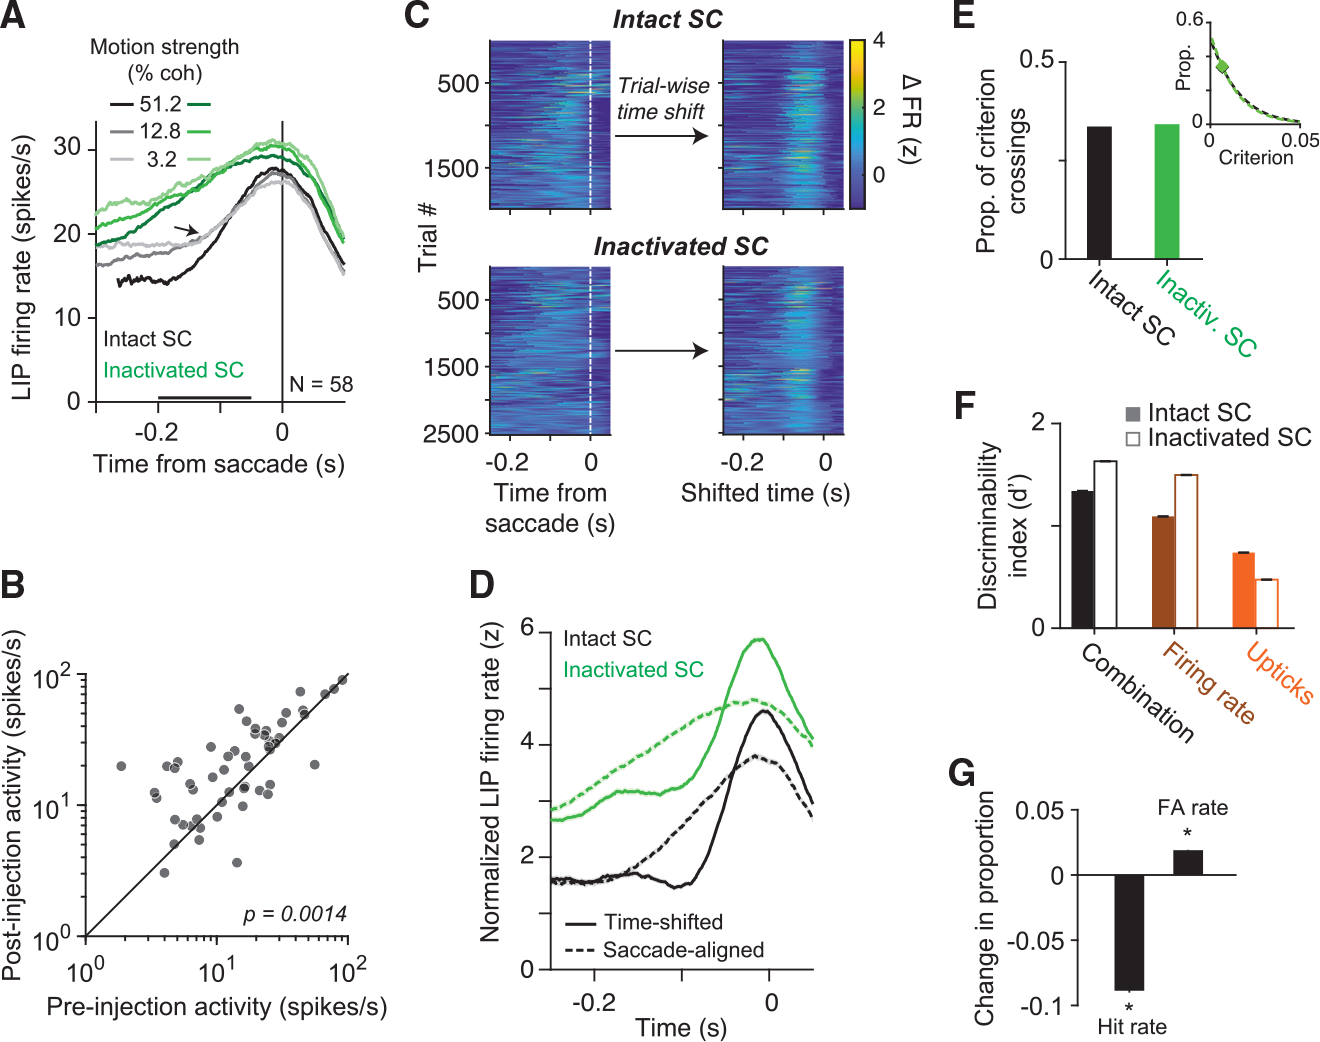
Figure 6. Altered readout of LIP activity following SC inactivation.

(A) Effect of SC inactivation on LIP population activity at the end of the decision. Mean firing rates of 58 LIP neurons before (gray curves) and after (green curves) SC inactivation are aligned to the onset of the saccade. Only choices are shown. Black bar denotes the epoch used for the analysis in (B). Arrow points to the uptick in LIP activity, which is less apparent after SC inactivation.
(B) Comparison of mean firing rates of individual neurons before and after SC inactivation. Activity was significantly greater after SC inactivation (p = 0.001, paired t test).
(C) Change in LIP firing rate on single trials relative to the saccade (left) and after trial-wise time shifting to optimize alignment of upticks (right). trials across all sessions are shown. Top, pre-inactivation trials. Bottom, after SC inactivation. Time shifting was performed independently for the two datasets (see STAR Methods).
(D) Trial-averaged firing rate in LIP before (dashed curve) and after (solid curve) time-shifting. Time-shifting suggests that upticks are present in LIP activity both before and after SC inactivation, though they are not apparent in saccade-aligned, post-inactivation activity (green dashed curve, similar to (A)).
(E) The proportion of time points between motion onset and saccade onset in which the firing rate derivative exceeded a criterion before (black) and after (green) SC inactivation. The criterion’s value is the same as that used in (G). Inset depicts the proportion of criterion crossings as a function of the criterion. The criterion used in the main panel is shown by the data points. The analysis suggests that SC inactivation did not reduce the frequency of upticks in LIP.
(F) The same analysis as in Figure 4D applied to data before and after SC inactivation. Note the decrease in d′ associated with the derivative signal and the increase associated with the other two quantities, suggesting that upticks are less predictive of decision termination after SC inactivation.
(G) Change in hit rate and false alarm rate associated with the derivative after SC inactivation, assuming no change in criterion. Asterisk denotes p< 0.05, Chi-squared test.
