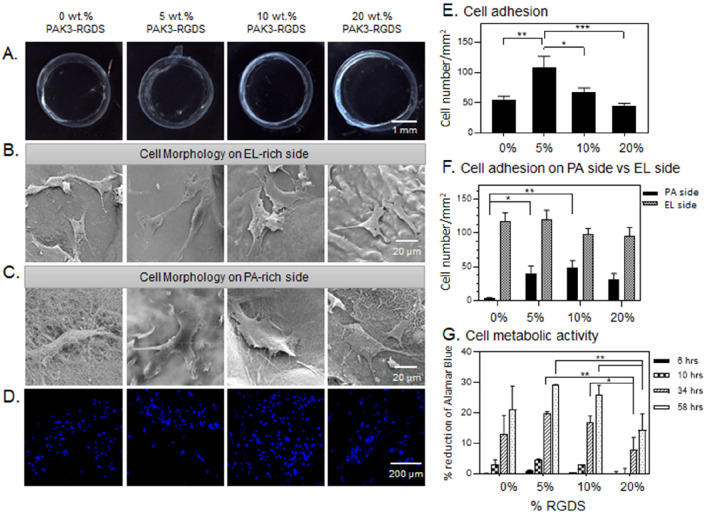
Figure 4.
Modification of bioactivity of EL-RGDS/PAK3/PAK3-RGDS membranes. (A) Bright-field images of EL-RGDS/PAK3/PAK3-RGDS membranes depending on concentration of PAK3-RGDS (0, 5, 10, and 20% (w/v)). (B,C) Morphology study. SEM micrographs of the membranes with mADSCs attached to the abluminal side of the membrane (EL side) (B), and SEM micrographs of the membranes with cells attached to the luminal side of the membrane (PA side) (C). (D) Cell adhesion study. mADSCs were stained with DAPI followed by imaging. (E) Cell adhesion density based on analysis of confocal images in (D). Error bars represent ±SEM. (F) Cell adhesion density on the luminal side of the membrane versus abluminal side of the membrane based on analysis of SEM micrographs. Error bars represent ±SEM. (G) Cell metabolic activity as assessed with an Alamar Blue assay. Error bars represent ±SD. Each experiment was conducted in triplicates (n = 6). Error bars represent ± SD or ± SEM where **** corresponds to p < 0.0001, *** corresponds to p < 0.001, ** corresponds to p < 0.01, and * corresponds to p < 0.05.

