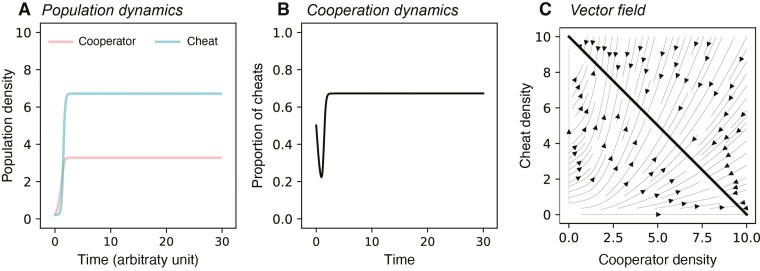
Figure 2.
Dynamics of the model in a simple set up. (A) Density of cooperator and cheat through time (i.e., population dynamics; and ). (B) Proportion of cheats through time (i.e., cooperation dynamics; ). (C) Vector field plot showing the model would have static dynamics once population densities reach carrying capacity (shown in thick black line) (a = 1, b = 0; other parameter values are listed in Supplementary Table S1).

