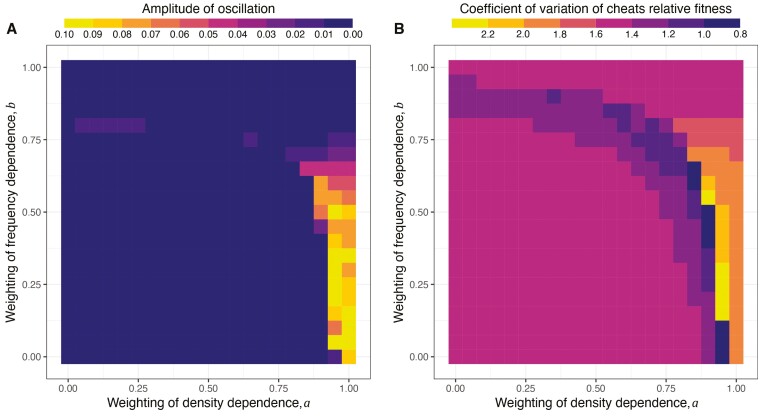
Figure 5.
The impacts of density and frequency dependence on oscillations across growth cycles and fitness landscape in scenario 3. (A) Amplitude of oscillation is calculated from the maximal signal of cheat proportion after discrete Fourier transformation. Brighter colors represent greater oscillation. (B) Coefficient of variation of relative fitness of cheats is calculated from the relative fitness of all subpopulations, using standard deviation divided by average, for each growth cycle. In all panels, each grid is the average of 10 repeated simulations. All simulations last 200 growth cycles and data was collected from cycle 51 to cycle 200. The number of subpopulations is set to 4,000.

