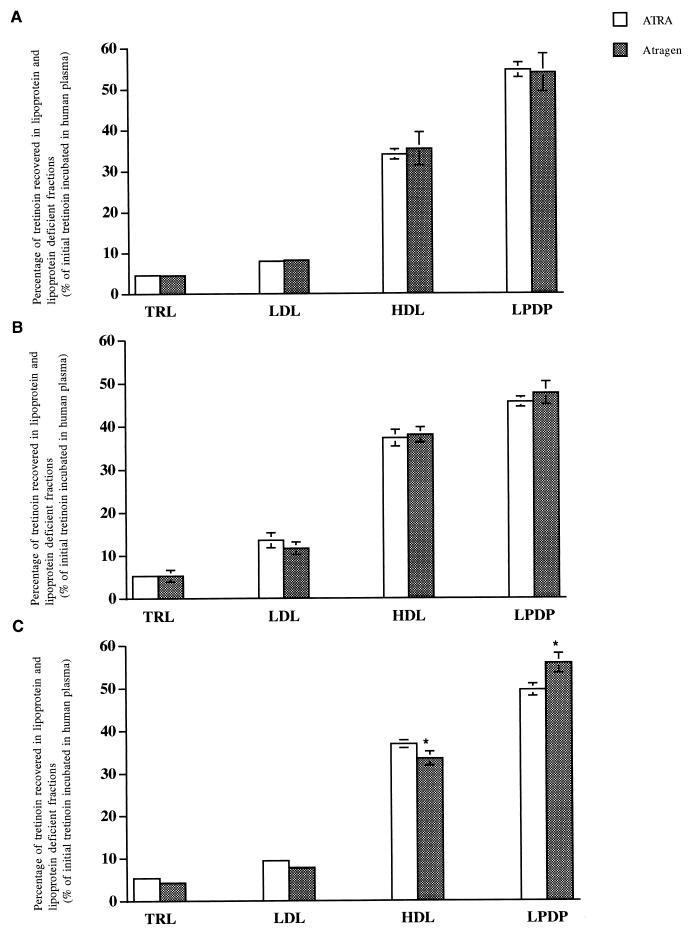
FIG. 1.
Distribution of free ATRA and Atragen (25 μg/ml) in human plasma following incubation for 5 (A), 60 (B), and 180 (C) min at 37°C. Data are expressed as percentages of total tretinoin distributed into TRL, LDL, HDL, and LPDP fractions and are reported as means ± standard deviations (error bars) (n = 6). ∗, P < 0.05 compared to value for ATRA.

