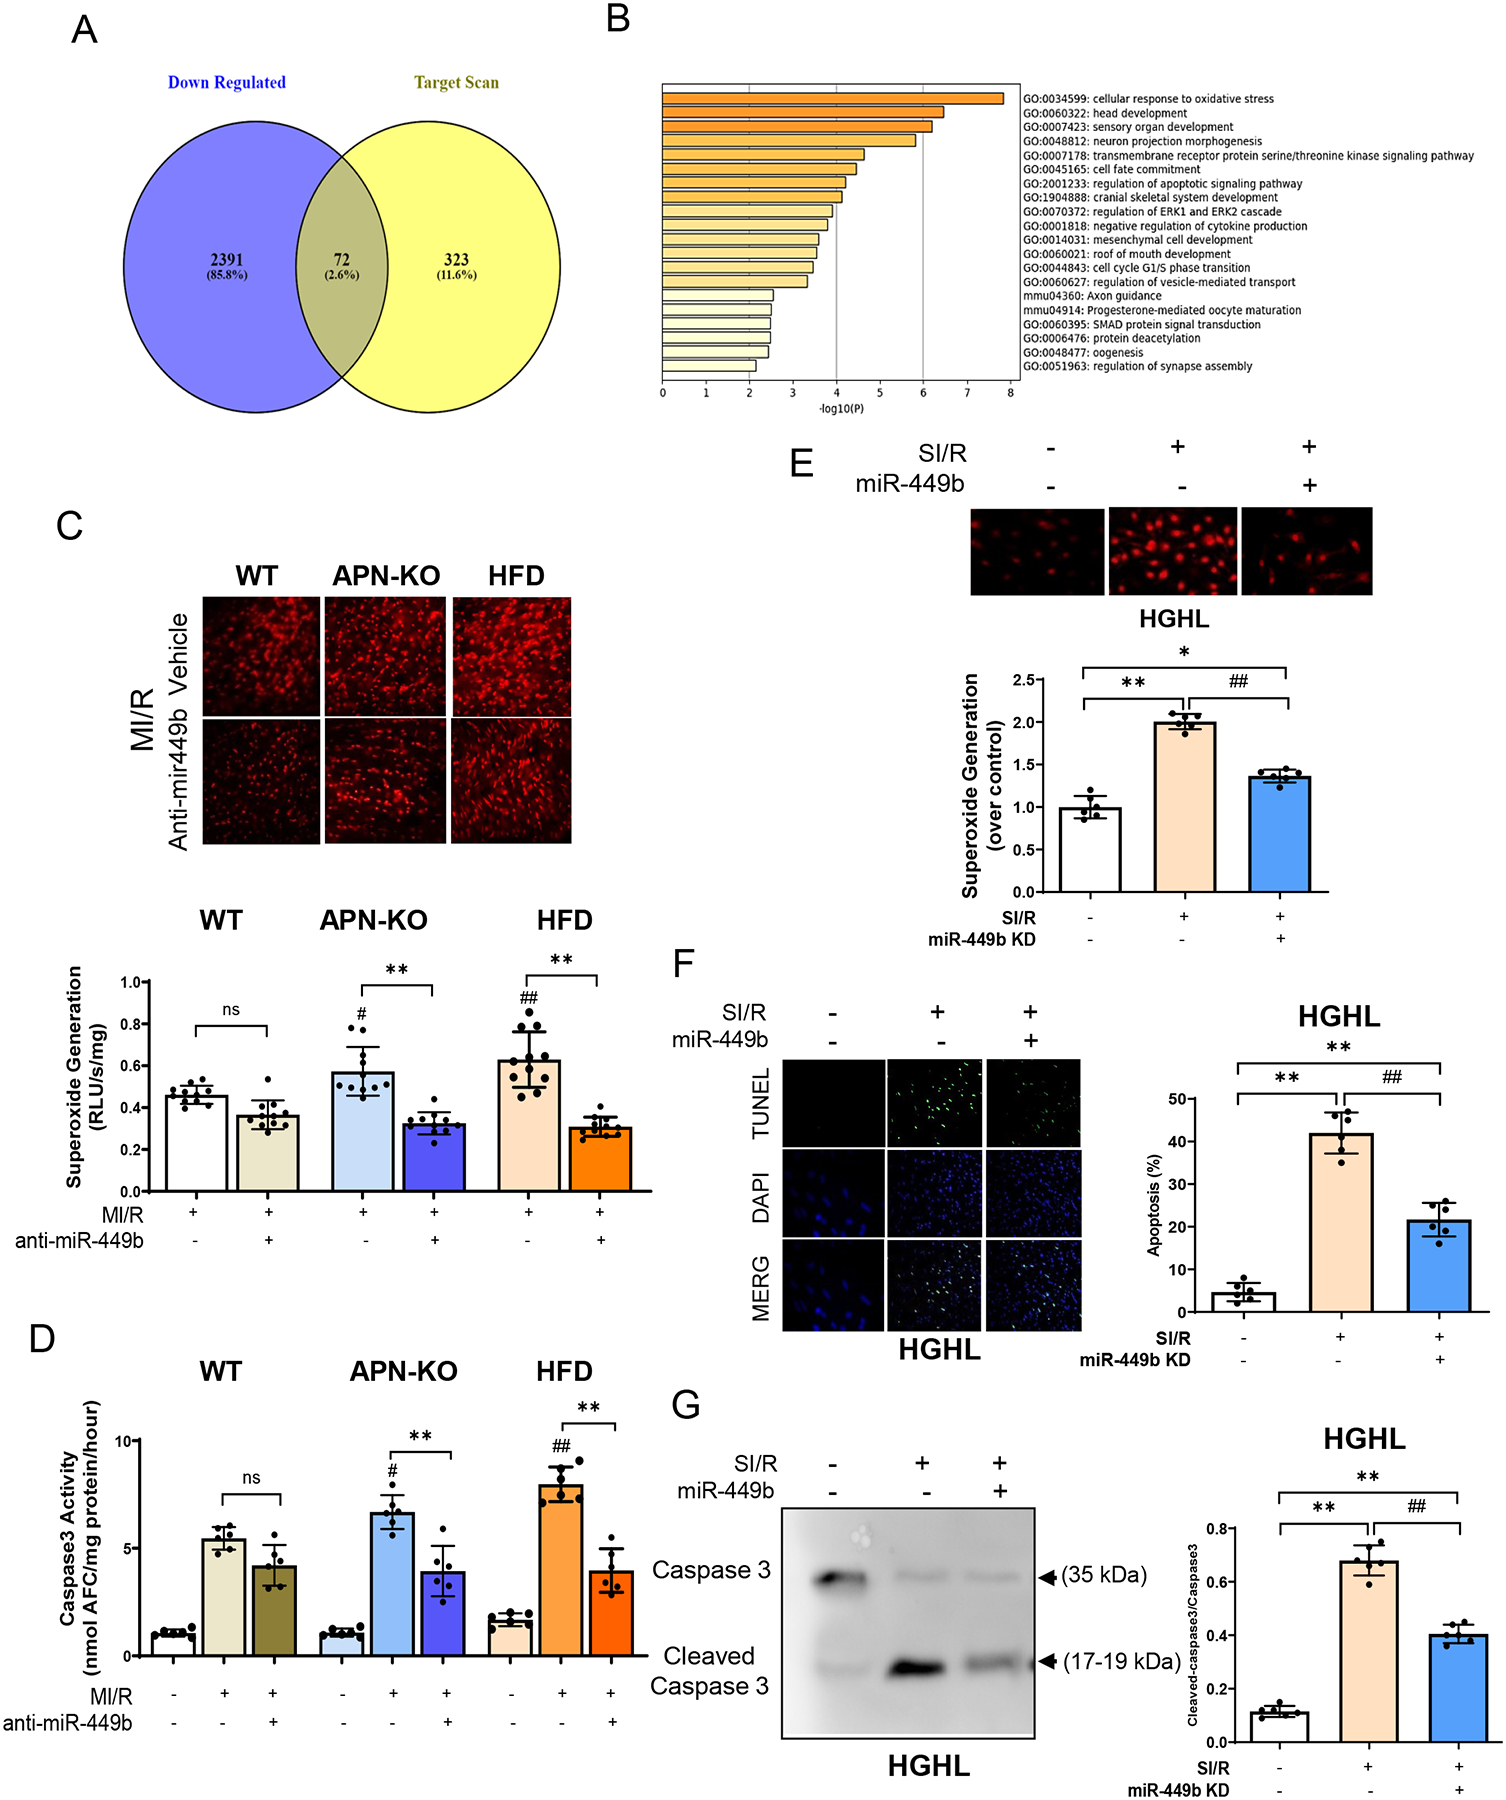
Figure 3. Oxidative stress evaluation in animal model.

A. Venn diagram shows that 72 targets were the same over-crossed from predicted targets for miR-449b. B. Go analysis showing signaling pathways regulated by miR-449b targeting genes. C. DHE assay (up panel) and Lucigenin assay detection (down panel) for superoxide generation in WT, APN-KO, and HFD mice subjected to MI/R with anti-miR-449b administration. **p < 0.01 versus MI/R group, respectively; #p < 0.05 & ## p < 0.01 versus WT-MI/R group. D. Caspase 3 activity evaluations in generation in WT, APN-KO, and HFD mice subjected to MI/R with anti-miR-449b administration. **p < 0.01 versus MI/R group, respectively; #p < 0.05 & ## p < 0.01 versus WT-MI/R group. For C and D, statistical significance was evaluated by two-way ANOVA. Post hoc pairwise tests for indicated group pairs were performed after Tukey correction. E. Superoxide generation in cultured NRCMs subjected to SI/R with anti-miR-449b administration. *p < 0.05 & **p < 0.01 versus control group; ## p < 0.01 versus SI/R group. F. Apoptosis evaluation by TUNEL stain assay (green) in HGHL-induced diabetic NRCMs with anti-miR-449b administration. DAPI (blue). **p < 0.01 versus control group; ## p < 0.01 versus SI/R group. G. Cleaved Caspase 3 evaluated by Western blot in HGHL-induced diabetic NRCMs with anti-miR-449b administration. **p < 0.01 versus control group; ## p < 0.01 versus SI/R group. n=6–11/group, 3 independent experiments. For E-G, statistical significance was evaluated by one-way ANOVA. Tukey tests were used to correct for multiple comparisons. I/R, myocardial ischemia/reperfusion; SI/R, Simulated ischemia/reperfusion; HGHL, High glucose, and high lipids; KD, Knockdown.
