Figure 1.

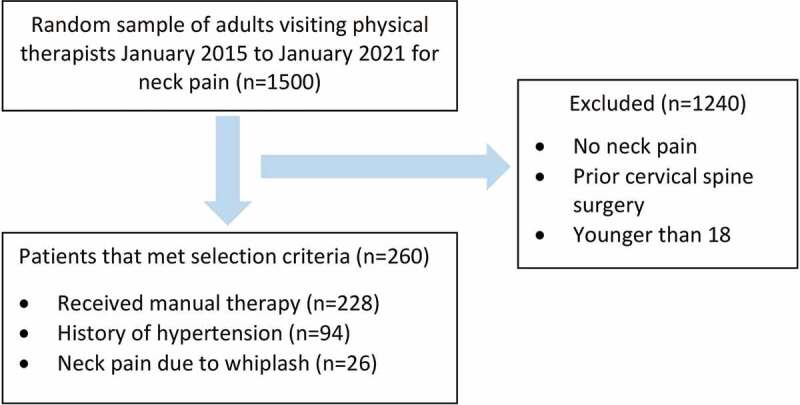
Flow diagram of patients (n=260) who met inclusion criteria from initial group of patients eligible for the study (n=1500). In the bottom box, the itemized list equals greater than 260 as certain patients fit more than one criterion.

Flow diagram of patients (n=260) who met inclusion criteria from initial group of patients eligible for the study (n=1500). In the bottom box, the itemized list equals greater than 260 as certain patients fit more than one criterion.