Abstract
Previous research points to the heritability of risk-taking behaviour. However, evidence on how genetic dispositions are translated into risky behaviour is scarce. Here, we report a genetically-informed neuroimaging study of real-world risky behaviour across the domains of drinking, smoking, driving, and sexual behaviour, in a European sample from the UK Biobank (N=12,675). We find negative associations between risky behaviour and grey matter volume (GMV) in distinct brain regions, including amygdala, ventral striatum, hypothalamus, and dorsolateral prefrontal cortex (dlPFC). These effects replicate in an independent sample recruited from the same population (N=13,004). Polygenic risk scores for risky behaviour, derived from a genome-wide association study in an independent sample (N=297,025), are inversely associated with GMV in dlPFC, putamen, and hypothalamus. This relation mediates ~2.2% of the association between genes and behaviour. Our results highlight distinct heritable neuroanatomical features as manifestations of the genetic propensity for risk taking.
Introduction
Taking risks—an essential element of many human experiences and achievements—requires balancing uncertain positive and negative outcomes. For instance, exploration, innovation and entrepreneurship can yield great benefits, but are also prone to failure1. Conversely, excessive risk-taking in markets can have enormous societal costs, such as the generation of speculative price bubbles2. Similarly, common behaviours such as smoking, drinking, sexual promiscuity, or speeding are considered rewarding by many but might expose individuals and those around them to deleterious health, social, and financial consequences. In 2010, the combined economic burden in the United States of these risky behaviours was estimated to be about $593.3 billion3–6. Although previous findings point to the partial heritability of risk tolerance and risky behaviours7 and neuroanatomical measures exhibit high heritability8,9, little is known about the brain features involved in translating genetic dispositions into risky behavioural phenotypes8.
Recent research using structural brain-imaging data from small, non-representative samples (comprising up to a few hundred participants) has identified several neuroanatomical associations with risk tolerance10–12. However, this literature is limited by low statistical power13,14, and the generalizability of their findings to other populations is questionable. Small sample sizes have also limited the ability to control systematically for many factors that could confound observed relations between brain features and risky behaviour, such as height15 and genetic population structure16,17. Moreover, despite evidence that the effects of genetic factors are likely mediated by their influence on the brain and its development7,18, neuroscientific and genetic approaches to understanding the biology of risky behaviour have largely proceeded in isolation–perhaps due to the lack of large study samples that include both genetic and brain imaging measures.
Here, we utilize data obtained in a prospective epidemiological study of ~500,000 individuals aged 40 to 69 years [the UK Biobank (UKB)19,20] to carry out a pre-registered investigation (https://osf.io/qkp4g/, see Supplementary Methods for deviations from the analysis plan) of the relationship between individual differences in brain anatomy and the propensity to engage in risky behaviour across four domains (N=12,675, for sample characteristics see Figure 1 and Extended Data Figure 1). We replicate our findings in an independent sample recruited from the same population (N=13,004, for sample characteristics see Extended Data Figure 2). Further, we isolate specific differences in brain anatomy that are linked to the genetic disposition for risky behaviour— quantified via polygenic risk scores (PRS) derived from a genome-wide association study (GWAS) in an independent sample (N = 297,025)—and investigate how these neuroanatomical endophenotypes mediate the influence of genetics on the behavioural phenotype.
Figure 1. |.
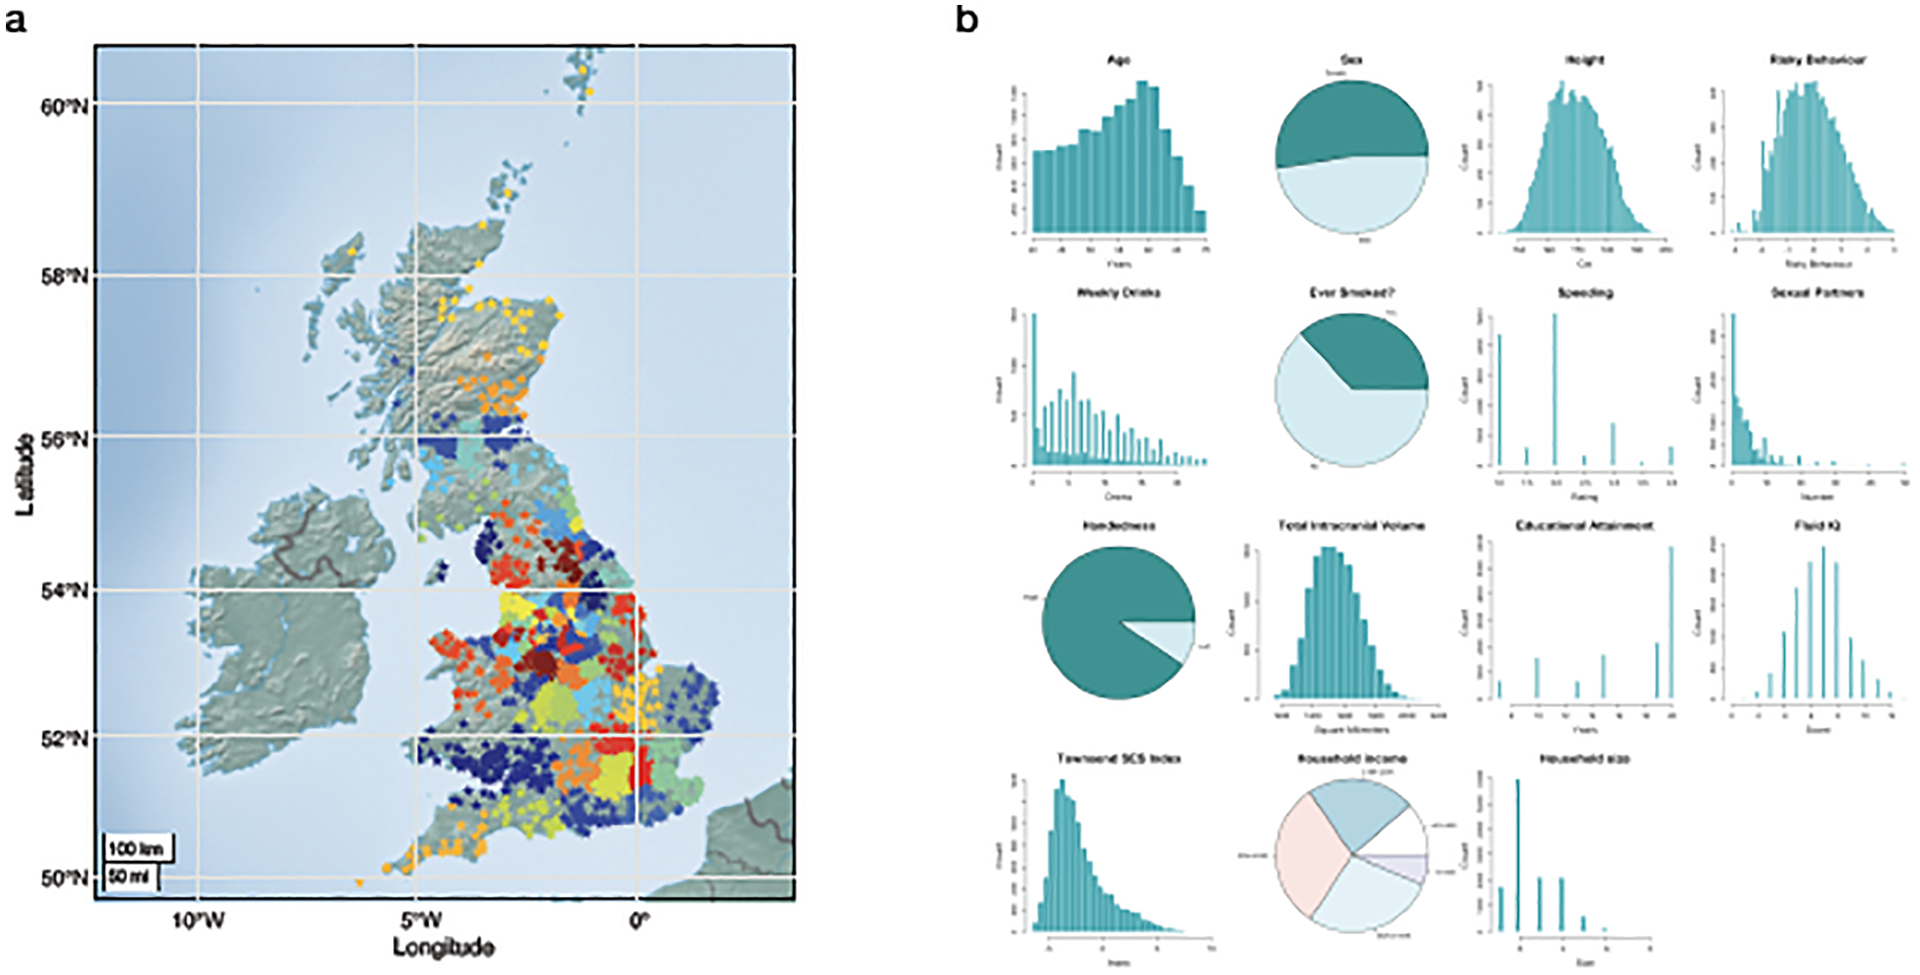
Main Sample Characteristics (N=12,675). (A) Geographical birth location clusters of the study’s participants. Each star represents the birthplace of a participant (non-jittered). Colours denote 100 geographical clusters, calculated using a k-means clustering algorithm with k = 100 and 10,000 iterations after random seeding. (B) Empirical distributions of variables in the main study sample.
Results
Grey Matter Volume Associations with Risky Behaviour
Akin to a previous investigation7, we construct a measure of risky behaviour by extracting the first principal component from four self-reported measures of drinking, smoking, speeding on motorways, and sexual promiscuity (N = 315,855; see Figure 2A, Supplementary Methods 1.1and Supplementary Tables 1–2 for descriptive statistics). This measure of risky behaviour is genetically correlated with many other traits, including cannabis use (rg = 0.72, SE = 0.02), general risk tolerance (rg = 0.56, SE = 0.02), self-employment (rg = 0.52; SE = 0.30), suicide attempt (rg = 0.47, SE = 0.07), antisocial behaviour (rg = 0.45, SE = 0.14), extraversion (rg = 0.34, SE = 0.04), and age at first sexual experience (rg = −0.54, SE = 0.02) (Supplementary Methods 1.5 and Supplementary Table 3). Thus, our measure is partly rooted in genetic differences between people and relates to a broad range of relevant events and behaviours.
Figure 2. |.
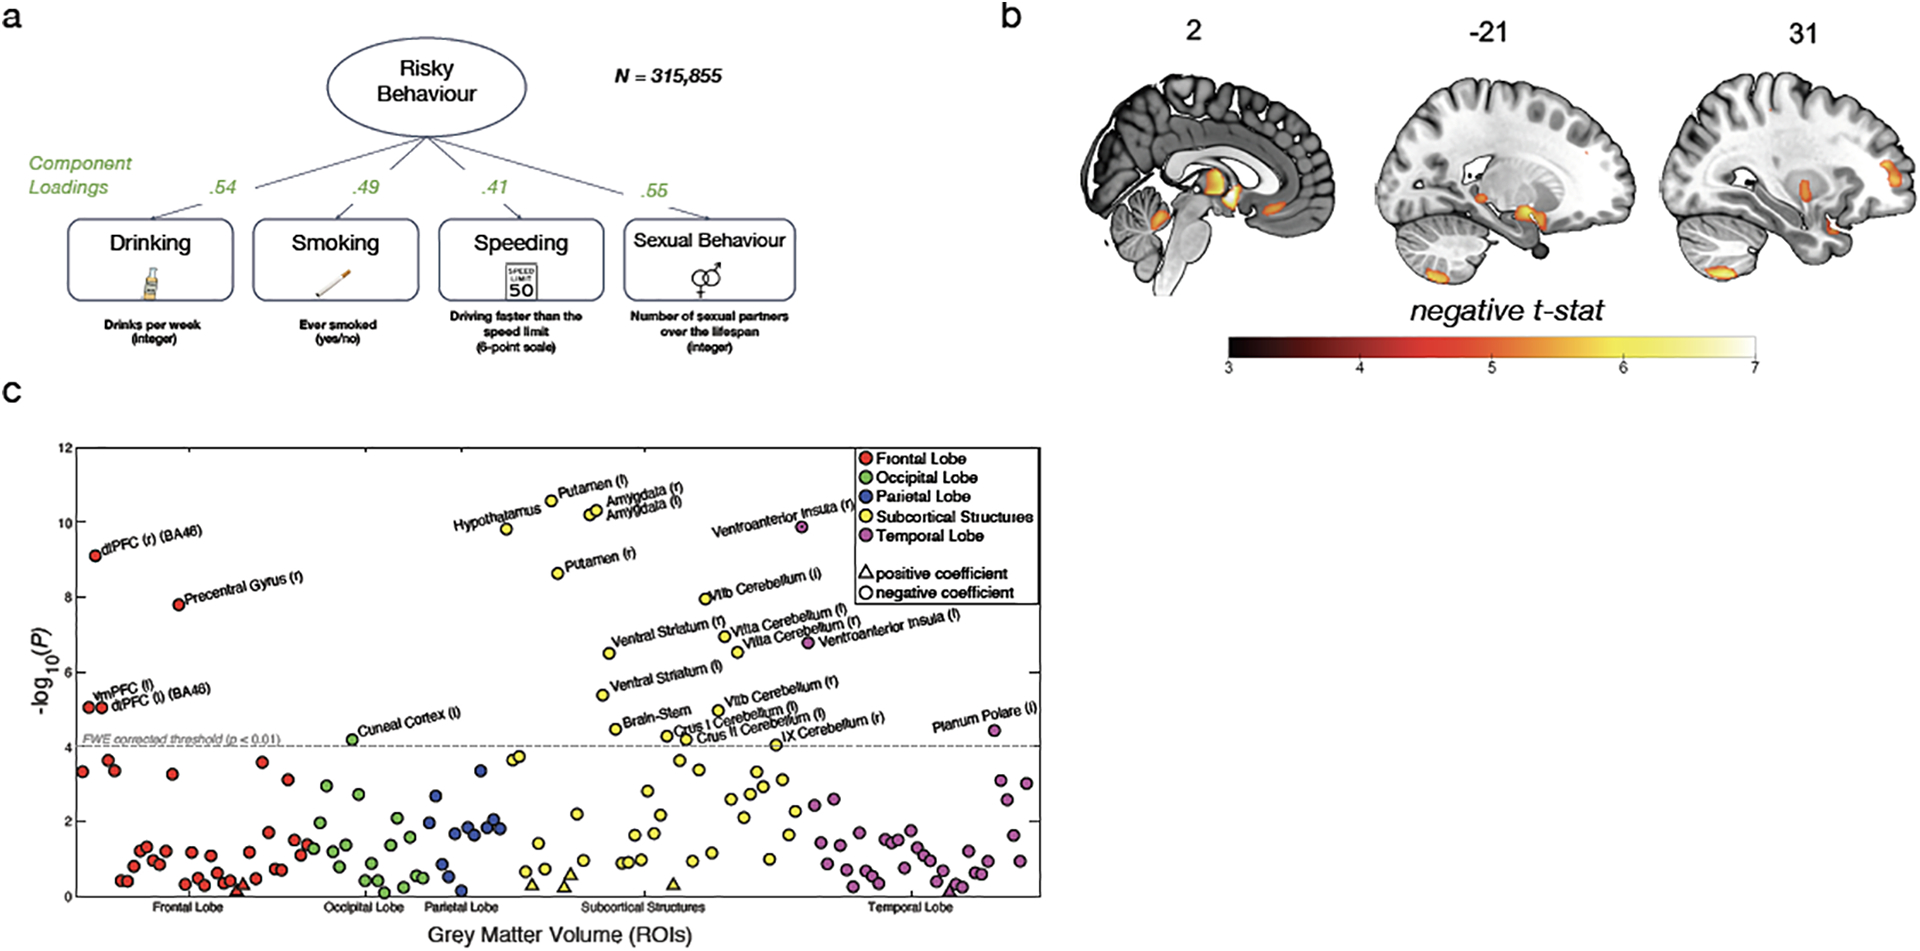
Association between Risky Behaviour and Imaging-Derived Phenotypes (IDPs) of Grey Matter Volume (GMV). (A) Loadings for the first principal component are extracted from four self-reported measures of risky behaviour in the drinking, smoking, driving and sexual domains (N = 315,855) (see Figure 1 for descriptive statistics). We use this first principal component as a measure of risky behaviour. (B) Voxel-level GMV negatively associated with risky behaviour (N = 12,675). We observe associations in subcortical areas, including thalamus, posterior hippocampus, amygdala, putamen, ventral striatum and cerebellum. Associations with cortical areas include posterior middle temporal gyrus, precentral gyrus, dlPFC, anterior insula and vmPFC. (C) Associations between risky behaviour and GMV in 148 regions of interest (ROIs)` (N = 12,675). The grey dotted line shows the FWE corrected threshold of P = 0.01 (see Methods for details).
Our main analysis includes a sample of 12,675 European-ancestry participants from the UKB. We first regress our measure of risky behaviour on total (whole-brain) grey matter volume (GMV) while controlling for age, birth year, gender, handedness, height, total intracranial volume and the first 40 genetic principal components, which account for genetic population structure (see Supplementary Methods 1.2). To exclude confounding effects of excessive alcohol consumption21, we excluded from the analysis all current or former heavy drinkers (see Methods)22,23. We find an inverse association between total GMV and risky behaviour (standardized β = −.122; 95% confidence interval (CI) [−.156, −.087]; t(12,561) = −6.92; P < 4.86 × 10⁻¹², two-sided).
To identify specific brain regions related to risky behaviour, we perform a whole-brain voxel-based morphometry (VBM)24 analysis that regresses our measure of risky behaviour separately on GMV in each voxel across the brain, adjusting for the same control variables. We identify localized inverse associations between risky behaviour and GMV in distinct regions, only some of which were expected based on previous small-scale studies (see Figure 2B, Extended Data Figure 3 and Supplementary Table 4). In subcortical areas, we identify associations bilaterally in expected areas such as the amygdala and ventral striatum (VS), as well as in less expected areas such as the posterior hippocampus, putamen, thalamus, hypothalamus, and cerebellum. We also identify bilateral associations between risky behaviour and GMV in cortical regions that include the ventral medial prefrontal cortex (vmPFC), dorsolateral prefrontal cortex (dlPFC), ventro-anterior insula (aINS) and the precentral gyrus. In all of these regions, GMV is negatively associated with the propensity to engage in risky behaviours. We find no positive associations between GMV and risky behaviour anywhere in the brain.
To quantify effect sizes of the associations between risky behaviour and GMV in anatomically-defined brain structures and to investigate the convergence of our findings across MRI processing pipelines25, we conduct a follow-up analysis at the region of interest (ROI) level. This analysis primarily relies on the imaging-derived phenotypes (IDPs) provided by the UKB brain imaging processing pipeline8,26,27, which used parcellations from the Harvard-Oxford cortical and subcortical atlases and the Diedrichsen cerebellar atlas. We derived additional IDPs using unbiased masks based on the results of the voxel-level analysis (see Supplementary Methods 1.3.3). This analysis identifies negative associations between risky behaviour and GMV in 23 anatomical structures, with standardized βs between −0.079 and −0.036 (see Figure 2C, Extended Data Figure 4 and Supplementary Table 5; for the associations between the IDPs and the individual measures that construct our phenotype of Risky Behavior, see Supplementary Table 6), the largest of which is in the right ventro-aINS; (β = −0.079; 95% CI [−.103, −.055]; t(12,562) = −6.43; Puncorr = 1.34 × 10⁻¹⁰, two-sided).
We carry out several additional analyses to assess the differential contributions of various factors to the associations we observe. First, we re-estimate the ROI-level regressions with additional controls for various socioeconomic and cognitive outcomes that may be linked to both brain anatomy and risky behaviour, either as antecedents or downstream consequences. These controls include participants’ years of education and fluid intelligence (13-item measure)17, a zip-code level measure of the Townsend social deprivation index28, household income and size, and birth location binned into 100 geographical clusters (see Supplementary Methods 1.2 and Figure 1). The direction and magnitude of all ROI effects are comparable to the main analysis (range of standardized βs between −0.079 and −0.035), with the largest effect again located in the right ventro-aINS (β = −0.079; 95% CI [−.104, −.055]; t(11,647) = −6.29; Puncorr = 3.3 × 10⁻¹⁰, two-sided). Furthermore, 19 of the 23 ROIs (all except the left Cuneal Cortex, left Crus I of the Cerebellum, left Planum Polare and the Brain Stem) are statistically significant after correction for multiple comparisons in this analysis (see Extended Data Figure 5 and Supplementary Table 5).
Second, we re-estimate our ROI-level regressions with additional controls for current levels of drinking (binned into 10 deciles) and smoking (binned into 3 categories). Although introducing these controls into the model regresses out variance of interest from the main outcome measure, which likely attenuates the effects, this analysis allows us to test whether any of the identified associations can reliably be attributed to risky behaviour that is not limited to the substance-use domain. In this analysis, we find that all of the effects originally identified remain negative in sign, yet are smaller in magnitude (range of standardized βs between −0.041 and −0.011; see Supplementary Table 7). Nonetheless, the effects in 9 subcortical ROIs (including the Amygdala, Putamen, VS and Cerebellum) remain statistically significant after correction for multiple comparisons (see Extended Data Figure 6), with the strongest association identified in the left Amygdala (β = −0.041; 95% CI [−0.059, −0.023]; t(12,551) = −4.4; Puncorr = 1.1 × 10⁻⁵, two-sided). Thus, these subcortical IDPs are reliably associated with risky behaviour in non-substance use domains.
Replication in an Independent Sample
Several months after the completion of our original analyses (in February 2020; https://biobank.ndph.ox.ac.uk/showcase/exinfo.cgi?src=timelines), the UKB released brain images of 20,316 additional participants— providing us with an opportunity to replicate our findings in an independent dataset that contains the same variables, and participants recruited in the same way from the same population29. After applying the same exclusion criteria as in our original analysis, our replication sample consists of 13,004 participants, roughly the same size as our original sample (see Methods for details and Extended Figure 1 for sample characteristics). We repeat both the voxel-level and ROI-level analyses in this dataset. In the voxel-level analysis, we apply a significance threshold that corresponds to a family-wise-error (FWE) rate of 5% in all voxels that showed significance in the original analysis (puncorr = 2.956 × 10−04, with tuncorr(12,892) = 3.62, two-sided). We find that 92.6% of the original voxels (located in 20 of the 21 clusters originally identified, with the exception of a cluster in cerebellar lobules I-IV) successfully replicate (see Figure 3). Furthermore, the un-thresholded t-map25 of the original dataset strongly correlates with the un-thresholded t-map of the replication dataset (r = .767; 95% CI [.766, .768]; P < 10−10, two-sided). Likewise, our ROI-level analysis successfully replicates 21 of the original 23 ROI-level findings (puncorr = 3.35 × 10−03, with tuncorr(12,892) = 2.93, two-sided; see Supplementary Table 8). The two ROIs that do not replicate are the Cuneal Cortex (left) and the cerebellar lobule II (left).
Figure 3 |.
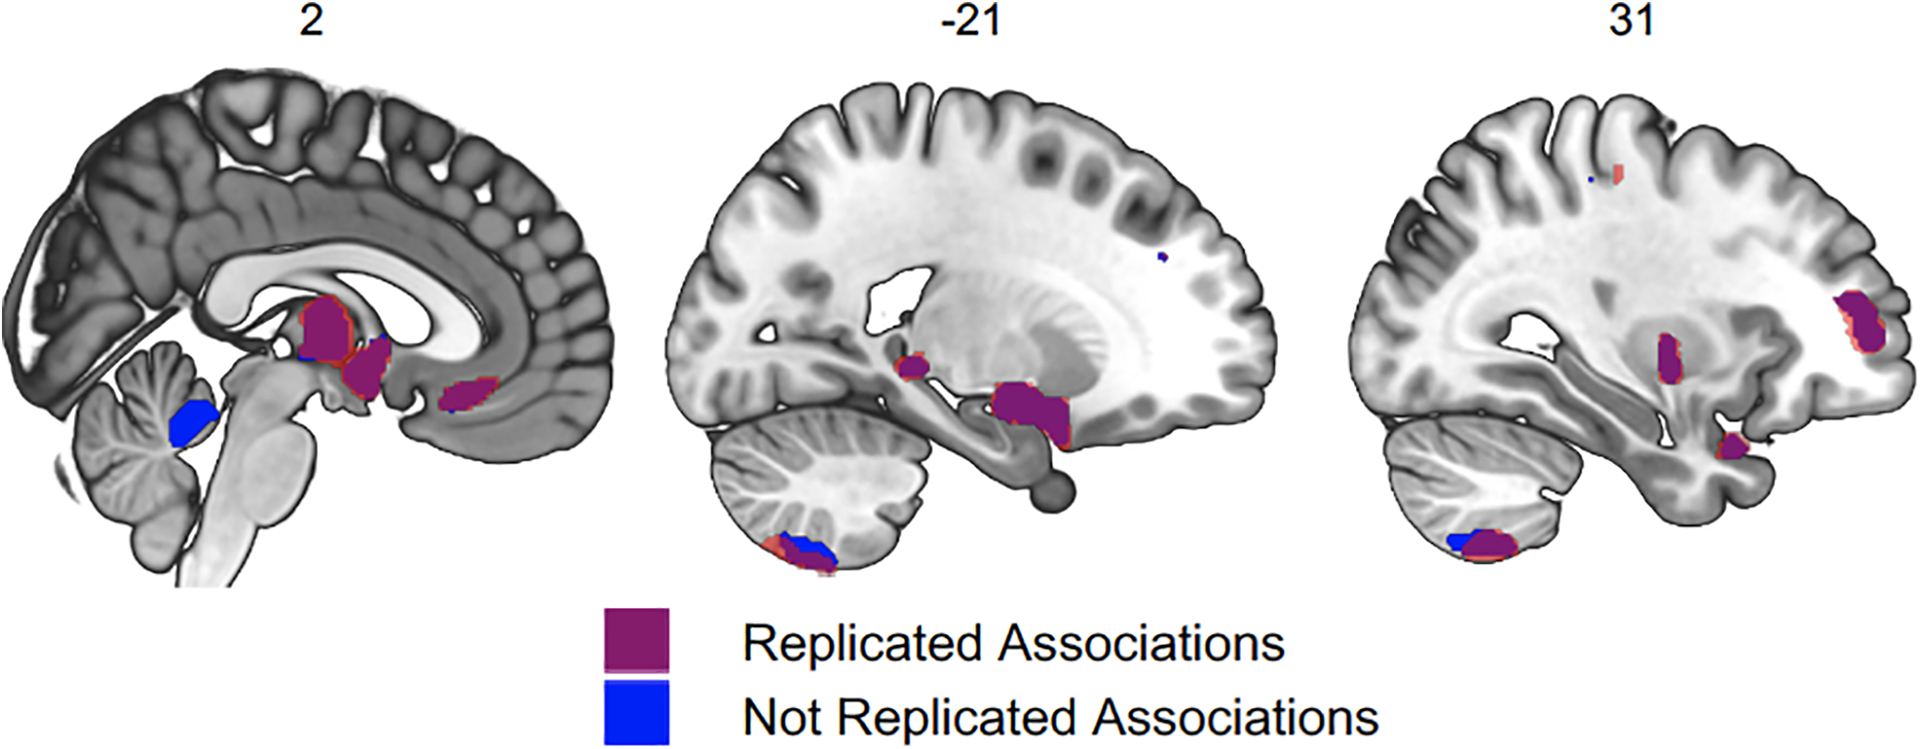
Voxel-level Grey Matter Volumes (GMV) associated with risky behaviour in the replication sample (N = 13,004). 92.6% of the voxels identified in our original analysis (located in 20 out of 21 original clusters identified, marked in purple) successfully replicate (corrected for multiple testing at the 5% level using a permutation test). Non replicated voxels are located in the cerebellar lobules I-IV (marked in blue).
Overlap between Grey Matter Volume Differences and Functional MRI (fMRI) Meta-Analysis
To investigate whether the neuroanatomical associations of real-world risky behaviour correspond spatially with the localized activation patterns commonly identified in fMRI studies of risky decision-making, we conduct a conjunction analysis to compare our VBM results with data obtained from a publicly available meta-analysis of fMRI studies of risky behaviour30 (N = 4,717 participants, K = 101 individual studies, see Supplementary Table 9). The analysis reveals several brain regions whose anatomical associations with risky behaviour converge with functional engagement, including the thalamus, amygdala, vmPFC, and dlPFC (see Figure 4 and Extended Data Figure 7).
Figure 4 |.

Conjunction between the Grey Matter Volume (GMV) differences associated with risky behaviour identified in the current study and the results of a meta-analysis of 101 fMRI studies, based on the keyword “risky”. This analysis identifies overlapping voxels in the thalamus, amygdala, vmPFC and dlPFC (see Methods for details).
Association of Polygenic Risk Scores for Risky Behaviour with Grey Matter Volume
Finally, we explore whether participants’ genetic disposition for risky behaviour, proxied via their polygenic risk scores (PRS), are associated with the neuroanatomical correlates of the trait, and test whether these neuroanatomical correlates mediate the relationship between genetic predisposition and behaviour. To this end, we first conducted a GWAS in an independent sample of UKB participants of European ancestry (N=297,025), exclusive of 18,796 genotyped individuals with usable MRI images (main sample) and their relatives. From the GWAS, we constructed a PRS that aggregated the effects of 1,176,729 single nucleotide polymorphisms (SNPs) on risky behaviour for all of the participants with MRI data in our independent target sample (see Supplementary Methods 1.4). The PRS predicts ~3% of the variance in risky behaviour in our target sample. Although we find no statistically significant evidence to suggest that the PRS are associated with whole-brain GMV (standardized β = −.015; 95% CI [-.05 .02]; t(12,561) = −0.82; P > 0.41, two-sided), they are inversely associated with GMV in distinct regions, specifically the right dlPFC, right putamen and hypothalamus (Figure 5A.; regressions include all standard control variables, including total intracranial volume). Thus, GMV in these specific brain areas is negatively associated with the genetic disposition for risky behaviour.
Figure 5. |.
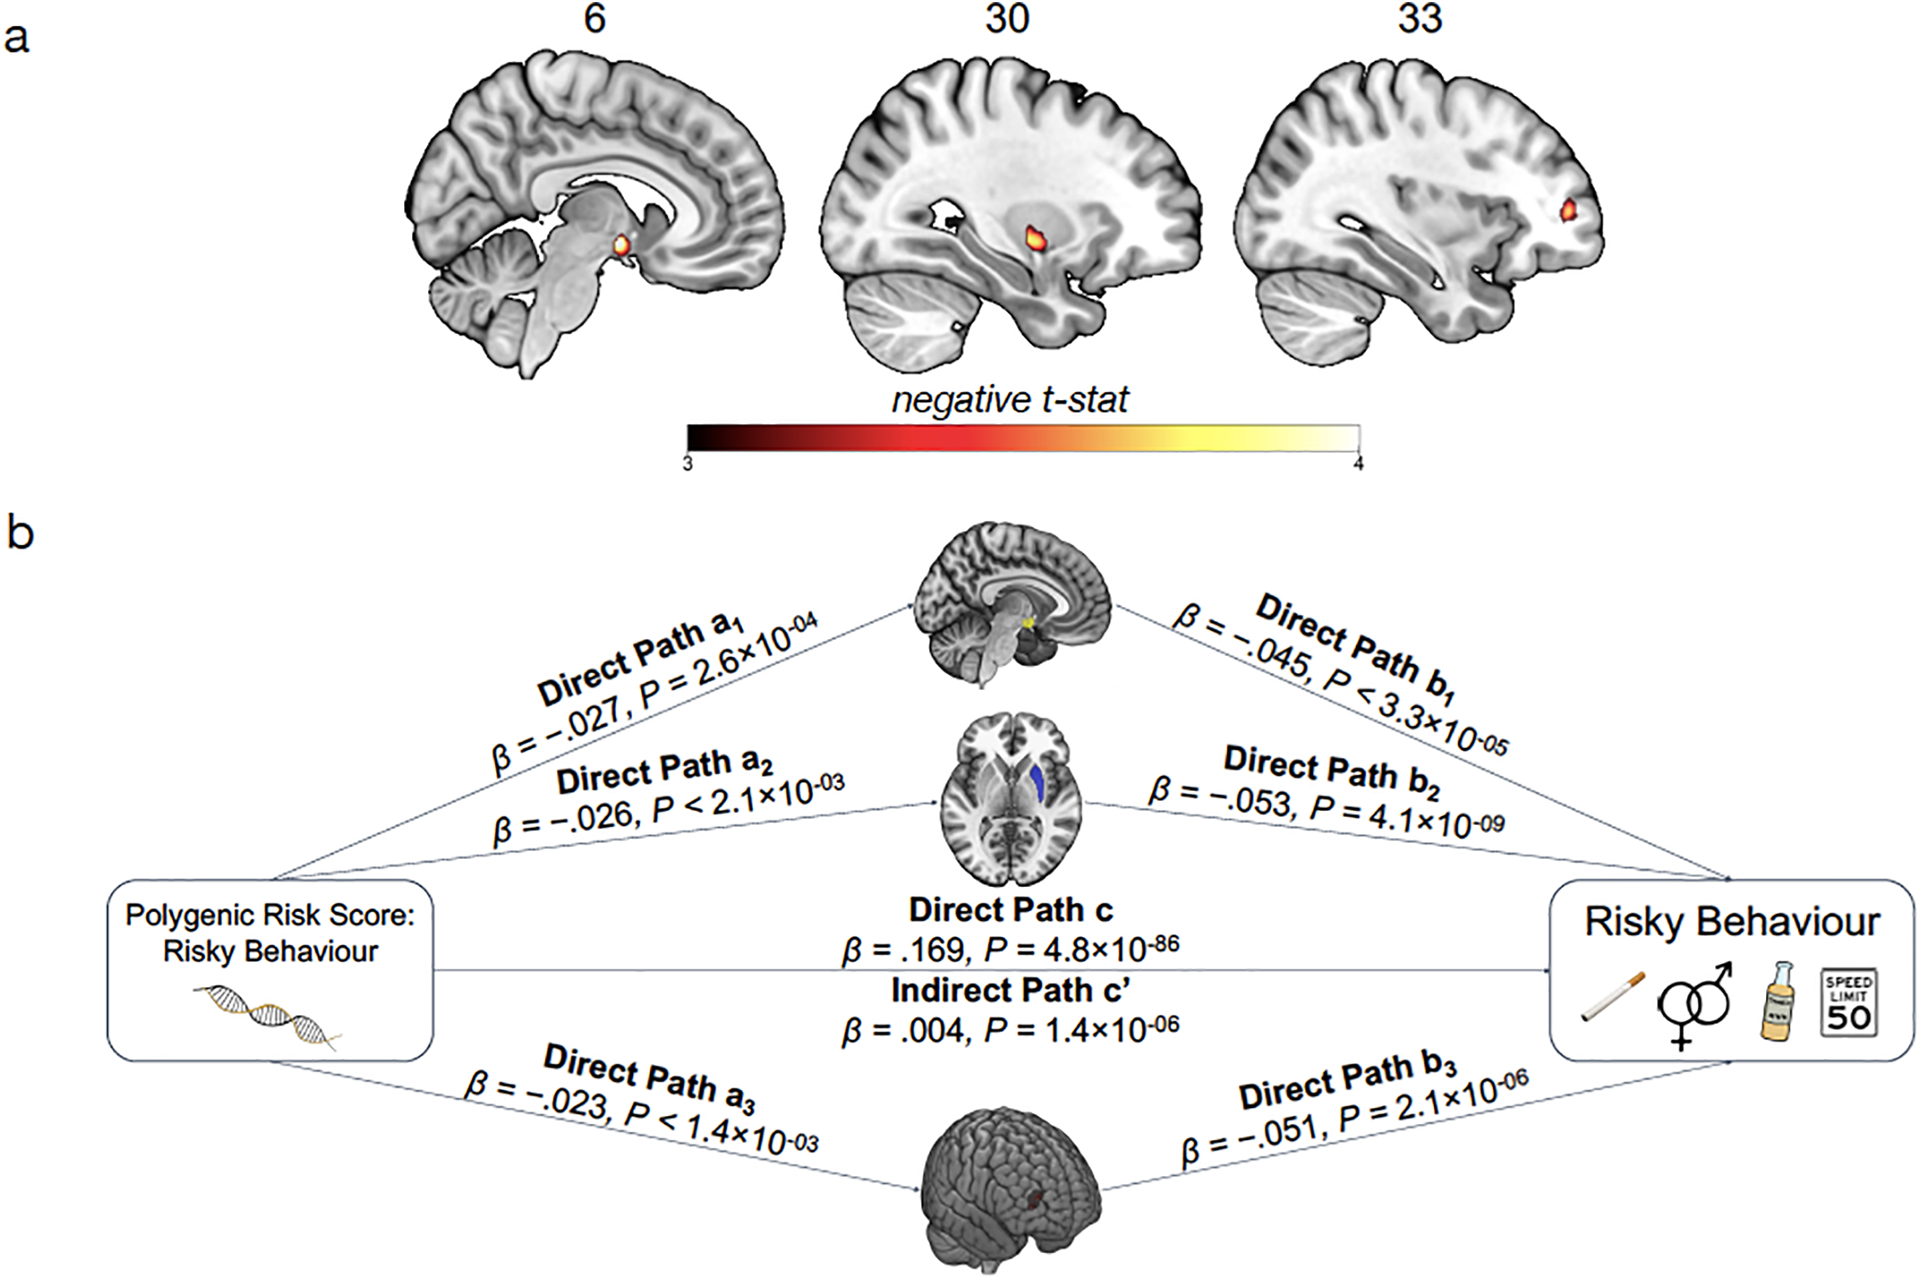
Association of Polygenic Risk Scores (PRS) for Risky Behaviour and Grey Matter Volume (GMV). (A) We constructed a PRS of risky behaviour from a GWAS in an independent sample (N=297,025) and investigated its associations with GMV in brain voxels that we identified as linked to risky behaviour. The PRS negatively correlates with GMV in the right dlPFC, putamen and hypothalamus. (B) GMV differences in hypothalamus (path 1, designated as a1 and b1), right putamen (path 2, designated as a2 and b2) and right dlPFC (path 3, designated as a3 and b3) mediate ~2.2% of the association between the PRS and risky behaviour. Arrows depict the direction of the structural equation modelling and do not imply causality (N = 12,675).
Based on these results, we use the previously extracted GMV of these three ROIs to examine whether it mediates the observed gene-behaviour associations. A structural equation model including all standard controls reveals that ~2.2% of the association between the PRS and risky behaviour is mediated through individual differences in GMV in the three regions (indirect path c’; standardized β = 0.004, 95%; CI [.002, .005]; z = 4.83; P = 1.4 × 10−06, two-sided) (see Figure 5B and Extended Data Figure 8).
Discussion
We investigate in a genetically-informed neuroimaging study (a) the association between GMV and real-world risky behaviour in a large population sample of European ancestry (main sample of 12,675 individuals and replication sample of 13,004 individuals), and (b) how the genetic disposition for risky behaviour is linked to GMV differences in a network of distinct brain areas. Several of the areas whose GMVs are linked to risky behaviour in this study have also often been functionally engaged during risky decision-making in small-scale fMRI studies that used stylized tasks. For instance, such correlations have been observed in the aINS, thalamus, dlPFC, vmPFC and VS31,32. These findings have led to proposals that upward and downward risks are encoded by distinct circuits, with upward risk mainly represented by areas encoding rewards (VS and vmPFC) and downward risk encoded by areas related to avoidance and negative arousal (aINS). Here, we substantiate previous functional studies with large-scale evidence that the structural properties of the same areas relate to risky behaviour in an ecologically valid setting33 when long-term health consequences are at stake.
Our results extend previous findings by showing that the neural foundation of risky behaviour is complex. Our analyses identify additional negative associations between risky behaviour and GMV in several areas, including the cerebellum, posterior hippocampus, hypothalamus, and putamen. While it is not yet clear how structural differences are manifested in properties of brain function34, our results suggest that risk taking draws on manifold neural processes, not just the representation and integration of upward and downward risks in the brain. Specifically, considering previous meta-analyses, the areas identified in this study are involved broadly in memory (posterior hippocampus), emotion processing (amygdala, ventro-aINS)35, neuroendocrine processes (hypothalamus)36,37, reward processing (vmPFC, VS and putamen)38 and executive functions (dlPFC)39. Thus, it appears that risky behaviour taps into multiple elements of human cognition, ranging from inhibitory control40 to emotion regulation41 and the integration of outcomes and risks42. This mirrors previous findings showing that risky behaviour is also a genetically complex trait7.
Additionally, our results underscore the long-suspected role of the hypothalamic–pituitary–adrenal (HPA) axis in regulating risk-related behaviours, in line with hormonal studies that link risky behaviour and sensation seeking to stress responsivity36,37,43–45. Furthermore, our finding that risky behaviour is linked to the structure of several cerebellar areas confirms the under-appreciated importance of the cerebellum for human cognition and decision-making, and highlights the need for further research on the specific behavioural contributions of this brain area46.
Of note, it remains an open question the extent to which the differences in GMV that we identify can be ascribed to specific heritable micro-anatomical traits, such as neuronal size, dendritic or axonal arborisation, or relative count of different cell types47. Moreover, it is not yet clear how these individual differences, in turn, influence behaviour. Nonetheless, our results provide evidence that neuro-anatomical structure constitutes the micro-foundation for neuro-computational mechanisms underlying individual differences in risky behaviours34.
Several of the observed neuroanatomical correlates of risky behaviour are also associated with the genetic disposition for the phenotype. Specifically, we find that GMV in the hypothalamus, the putamen and the dlPFC share variance with both risky behaviour and its polygenic risk score. This finding extends previous studies showing correlational36,42,43 and causal evidence37,48 of the involvement of these areas in risky behaviour by indicating that a genetic component partly underlies the associations. Although our analyses cannot identify the direction of the causal relationships (see Supplementary Discussion for an additional discussion of limitations), they show that risky behaviour and its genetic associations share variance with distinct GMV features and provide an overarching framework for how the genetic dispositions for risky behaviour may be expressed in the corresponding behavioural phenotype.
Our results are also in line with the bioinformatic annotation of the largest GWAS on risk tolerance to date, conducted in over 1 million individuals7, which implicated specific areas in the prefrontal cortex (BA9, BA24), striatum, cerebellum and the amygdala. However, bioinformatics tools used for GWAS annotation cannot be considered conclusive, as they rely on gene expression patterns in relatively small samples of (post-mortem) human brains or non-human samples49. Moreover, they cannot speak to whether changes in a particular tissue or cell type have negative or positive effects on the phenotype or how strong the effects are. Here, we show an alternative approach to annotating GWAS findings using a different type of data (large-scale population samples that include in-vivo brain scans and genetic data), relying on different assumptions than those used by bioinformatics tools. Our results add new insight by showing that lower GMV in specific brain areas is related to more risky behaviour and by implicating brain regions (i.e., putamen, hypothalamus, and dlPFC) in addition to those previously annotated. The effect sizes we observe here (standardized β < 0.08) are an order of magnitude larger than those found in GWAS on risky behaviour, but they nonetheless require very large samples for detection.
Finally, while many features of the brain are heritable, the environment indisputably plays an important role in brain development. We therefore see our results not as independent from, or of greater importance than, the effects of environmental and developmental factors. Rather, our study constitutes one step towards understanding how the complex development of human risky behaviour may be constrained by genetic factors.
Methods
Sample Characteristics and Selection Criteria
Main sample.
We use publicly available data from the UKB, which recruited 502,617 people aged 40 to 69 years from the general population across the United Kingdom19,20. All UKB participants provided written informed consent and the study was granted ethical approval by the North West Multi-Centre Ethics committee. Our initial sample consists of 18,796 individuals with brain scans and genotype data, all of the imaged UKB participants as of October 2018. We excluded participants with putative sex chromosome aneuploidy (N = 6) or a mismatch between genetic and reported sex (N = 10), participants of non-European ancestry (N = 893), and participants who did not pass the UKB quality-control thresholds (N = 14), described in Bycroft et al.27. To minimize the potential influence of neurotoxic effects due to excessive alcohol intake21,22, we also excluded current heavy drinkers (531 females consuming more than 18 drinks per week and 793 males consuming more than 24 drinks per week)22,23. To exclude potential former drinkers, we also removed 426 participants who indicated that they did not drink alcohol.
All structural T1 MRI images used in the study underwent automated quality control by the UKB brain imaging processing pipeline26. We performed two additional quality checks using the Computational Anatomy Toolbox (CAT; www.neuro.uni-jena.de/cat/) for SPM 12 (www.fil.ion.ucl.ac.uk/spm/software/spm12/). First, we relied on the CAT12 automated Image and Pre-processing quality assessment, which included quality parameters for resolution, noise, and bias of images, 57 of which were automatically excluded and not pre-processed due to low image quality. Second, after pre-processing, we utilized an automated quality check of sample homogeneity to identify outliers that exhibited substantially different GMV patterns than the rest of the sample (see the CAT12 manual for details; http://www.neuro.uni-jena.de/cat12/CAT12-Manual.pdf, p. 17ff). In total, we excluded 690 individuals with scans of high image inhomogeneity (two standard deviations below the mean). Finally, we excluded 2,701 participants with incomplete behavioural data of interest or control variables. Our final dataset consists of N = 12,675 individuals.
Replication sample.
The initial replication sample consisted of 20,316 individuals with usable brain scans and genotype data, all of the imaged UKB participants as of February 2020 who were not included in our main sample. Following the original analysis, we excluded participants with putative sex chromosome aneuploidy (N = 7), a mismatch between genetic and reported sex (N = 11), non-European ancestry (N = 1,143), heavy drinking or abstinence from alcohol (N = 1,376), and those that did not pass the UKB quality-control thresholds (N = 31)27. All T1 MRI images used in the study underwent the same quality control procedure as in our original sample, resulting in the removal of additional 391 individuals. Finally, we excluded participants with incomplete data (N = 4,353). Our final replication sample consists of N = 13,004. The empirical distributions of the variables characterizing our replication analysis are depicted in Extended Data Figure 2.
Measures
Risky Behaviour.
We closely follow Karlsson Linnér et al.7 to derive a measure of risky behaviour across domains based on participants’ self-reports of: (1) Number of alcoholic drinks per week, (2) Ever having smoked, (3) Number of sexual partners, and (4) Frequency of driving faster than the motorway speed limit (see Supplementary Methods 1.1). We perform principal component analysis (PCA) on N = 315,855 UKB participants and extract the first principal component (PC) of the four measures as the main outcome of interest (referred to as “risky behaviour”). The first PC explains ~37% of the variance in the four measures, and it is the only PC that loads positively on all of them. Summary statistics and factor loadings of the PCA are available in Supplementary Tables 1 and 2. The code for generating the variable of ‘risky behaviour’ is accessible at https://osf.io/qkp4g/.
Control variables.
The full list of control variables and the methods used to generate them are available in Supplementary Methods 1.2.
T1 MRI Image Processing.
We use T1-weighted structural brain MRI images in NIFTI format provided by the UKB. Images were acquired using 3-T Siemens Skyra scanners, with a 32-channel head coil (Siemens, Erlangen, Germany), with the following scanning parameters: repetition time = 2000 ms; echo time = 2.1 ms; flip angle = 8°; matrix size = 256 × 256 mm; voxel size = 1 × 1 × 1 mm; number of slices = 208. A detailed description of the methods used to pre-process the images and derive voxel-level and ROI-level IDPs is available in Supplementary Methods 1.3.1–1.3.3.
Polygenic Risk Score (PRS) for Risky Behaviour.
To construct a PRS, we first re-estimated the GWAS of our main measure described in ref7 after excluding 18,796 genotyped individuals with usable T1 MRI images and their relatives up to the third degree (final GWAS sample: N = 297,025 individuals of European ancestry). The GWAS was performed using linear mixed models (LMM), implemented via BOLT-LMM version 2.3.250. Next, we performed quality control (QC) of the GWAS results using a standardized QC protocol, described in detail in ref7. This protocol removes rare and low-quality single-nucleotide polymorphisms (SNPs) based on minor allele frequency (MAF) < 0.001, imputation quality (INFO) < 0.7, and SNPs that could not be aligned with the Haplotype Reference Consortium (HRC) reference panel, among other filters. After QC, a total of 11,514,220 SNPs remained in the GWAS summary statistics. Thereafter, we calculated a PRS for each participant by weighting their genotype across SNPs by the corresponding regression coefficients estimated in the GWAS (see Supplementary Methods 1.4 for further information).
Analysis
Voxel-based Morphometry (VBM).
We identify associations between risky behaviour and localized GMV across the brain using whole-brain voxel-based morphometry (VBM), a method that normalizes the anatomical brain images of all participants in one stereotactic space24. We regress risky behaviour separately on each voxel of the smoothed GMV images (see Supplementary Methods 1.3.1) and the control variables. We correct for multiple comparisons by adjusting the FWE rate to α = 0.01 using permutation tests (puncorr = 1.248 × 10−06, with |tuncorr| = 4.85, two-sided). See Extended Data Figure 3 and Supplementary Table 4 for the summary statistics of each cluster and the coordinates of the peak voxel within that cluster.
Region of Interest (ROI)-level Analysis.
We compute the associations between risky behaviour and 139 IDPs of GMV extracted by the UKB brain imaging processing pipeline26 using parcellations from the Harvard-Oxford cortical and subcortical atlases and Diedrichsen cerebellar atlas, in addition to 9 IDPs derived using unbiased masks based on the results of our voxel-level analysis (see Supplementary Methods 1.3.2 and 1.3.3). We regress risky behaviour separately on each IDP and the control variables and correct for multiple comparisons by adjusting the FWE rate of α = 0.01 using permutation tests (puncorr = 9.37 × 10−05, with |tuncorr|= 3.91, two-sided).
Replication of the Voxel-level and ROI-level Analyses.
We repeat the VBM analyses in the replication sample for all voxels that showed significance in the original sample, correcting for multiple comparisons by adjusting the FWE rate to α = 0.05 (two-tailed) using permutation tests (puncorr = 2.956 × 10−04, with tuncorr = 3.62). We also repeat the ROI-level analysis in all ROIs that showed significance in the original sample, and correct for multiple comparisons by adjusting the FWE rate to α = 0.05 (two-tailed) using permutation tests (puncorr = 3.35 × 10−03, with tuncorr = 2.93). We define replication success as observing a statistically significant effect at the 5% level (corrected for multiple hypothesis testing) in the same direction as the original finding51.
Comparison of VBM Results with a Meta-Analysis of Functional MRI (fMRI) Studies.
We compare our VBM results with a publicly available meta-analysis of fMRI studies provided by Neurosynth30, an online platform for large-scale, automated synthesis of fMRI data (https://neurosynth.org/). The meta-analysis was based on the keyword ‘risky’. It consisted of K = 101 individual studies with a total of N = 4,717 participants (see Supplementary Table 9 for details), and was conducted using a uniformity test (assuming that random activations are evenly distributed across all voxels). The meta-analytic statistical image was corrected for multiple comparisons by applying a false discovery rate (FDR) of .01 (implemented by Neurosynth). The summary of studies included in the meta-analysis is available on Supplementary Table 9. The 3D activation map that resulted from the meta-analysis is available on https://neurosynth.org/analyses/terms/risky/. To compare our VBM results (i.e., brain structure) with the meta-analysis of data on brain function, we perform a whole-brain voxel-level conjunction analysis of the two (see Extended Data Figure 7) that exhibits the spatial overlap of all voxels that are significant in both analyses (Figure 4). Thus, both the structure and function of the brain regions identified by this conjunction are significantly associated with risky behaviour.
Voxel-based Morphometry (VBM) Analysis of Risky Behaviour PRS.
We repeat the VBM analysis in all voxels identified to be associated with risky behaviour, using the PRS as the dependent variable. This approach allows the identification of brain regions that were likely to mediate the effect of genetic disposition on risky behaviour. The PRS was constructed using GWAS results from an independent sample, to ensure that the effect size estimates in this analysis are not inflated due to overfitting. We account for multiple comparisons using a permutation test with an FWE rate of pFWE < 0.05. This part of the analysis was not pre-registered.
Mediation Analysis.
We conduct mediation analyses (implemented in STATA 14) to test whether GMV differences in the brain regions whose GMVs are associated with the PRS of risky behaviour (right dlPFC, right putamen and hypothalamus) mediate the association between the PRS and risky behaviour. We first extract GMV from these three ROIs using the same unbiased masks as in the ROI-level analysis (see Supplementary Methods 1.3.3). Then, we estimate a structural equation model (SEM) to quantify the effect of the PRS on risky behaviour mediated via GMV differences in these ROIs. All SEM equations include the aforementioned standard control variables (listed in Supplementary Methods 1.2). We carry out an additional robustness check by estimating an SEM that assumes one single path (i.e., the sum of all ROIs), which yields the same pattern of results (see Extended Data Figure 8).
Family-Wise-Error Correction using Permutation Tests.
To account for multiple hypothesis testing, we determine the appropriate FWE corrected p-value threshold with a permutation test procedure in each of our analyses52. To this end, we generated 1,000 datasets with randomly permuted phenotypes (i.e., breaking the link between the outcome and explanatory variables), estimated regression models for all IDPs per analysis, and recorded the lowest p-value of each run to generate an empirical distribution of the test statistic under the null hypothesis. To obtain the FWE rate of any given alpha, we use the nth = α × 1000 lowest p-value from the 1,000 permutation runs as the FWE corrected p-value threshold.
Pre-registration of Analysis Plan and Unplanned Deviations.
We pre-registered our analysis plan on Open Science Framework (OSF, https://osf.io/qkp4g/, registered Dec. 2018). Our pre-registered plan specified the construction of the dependent variable, the control variables, the inclusion criteria and quality controls, the VBM analyses and the main ROI-level analyses. We summarize all deviations from the analysis plan in Supplementary Methods 2.
Extended Data
Extended Data Fig. 1:
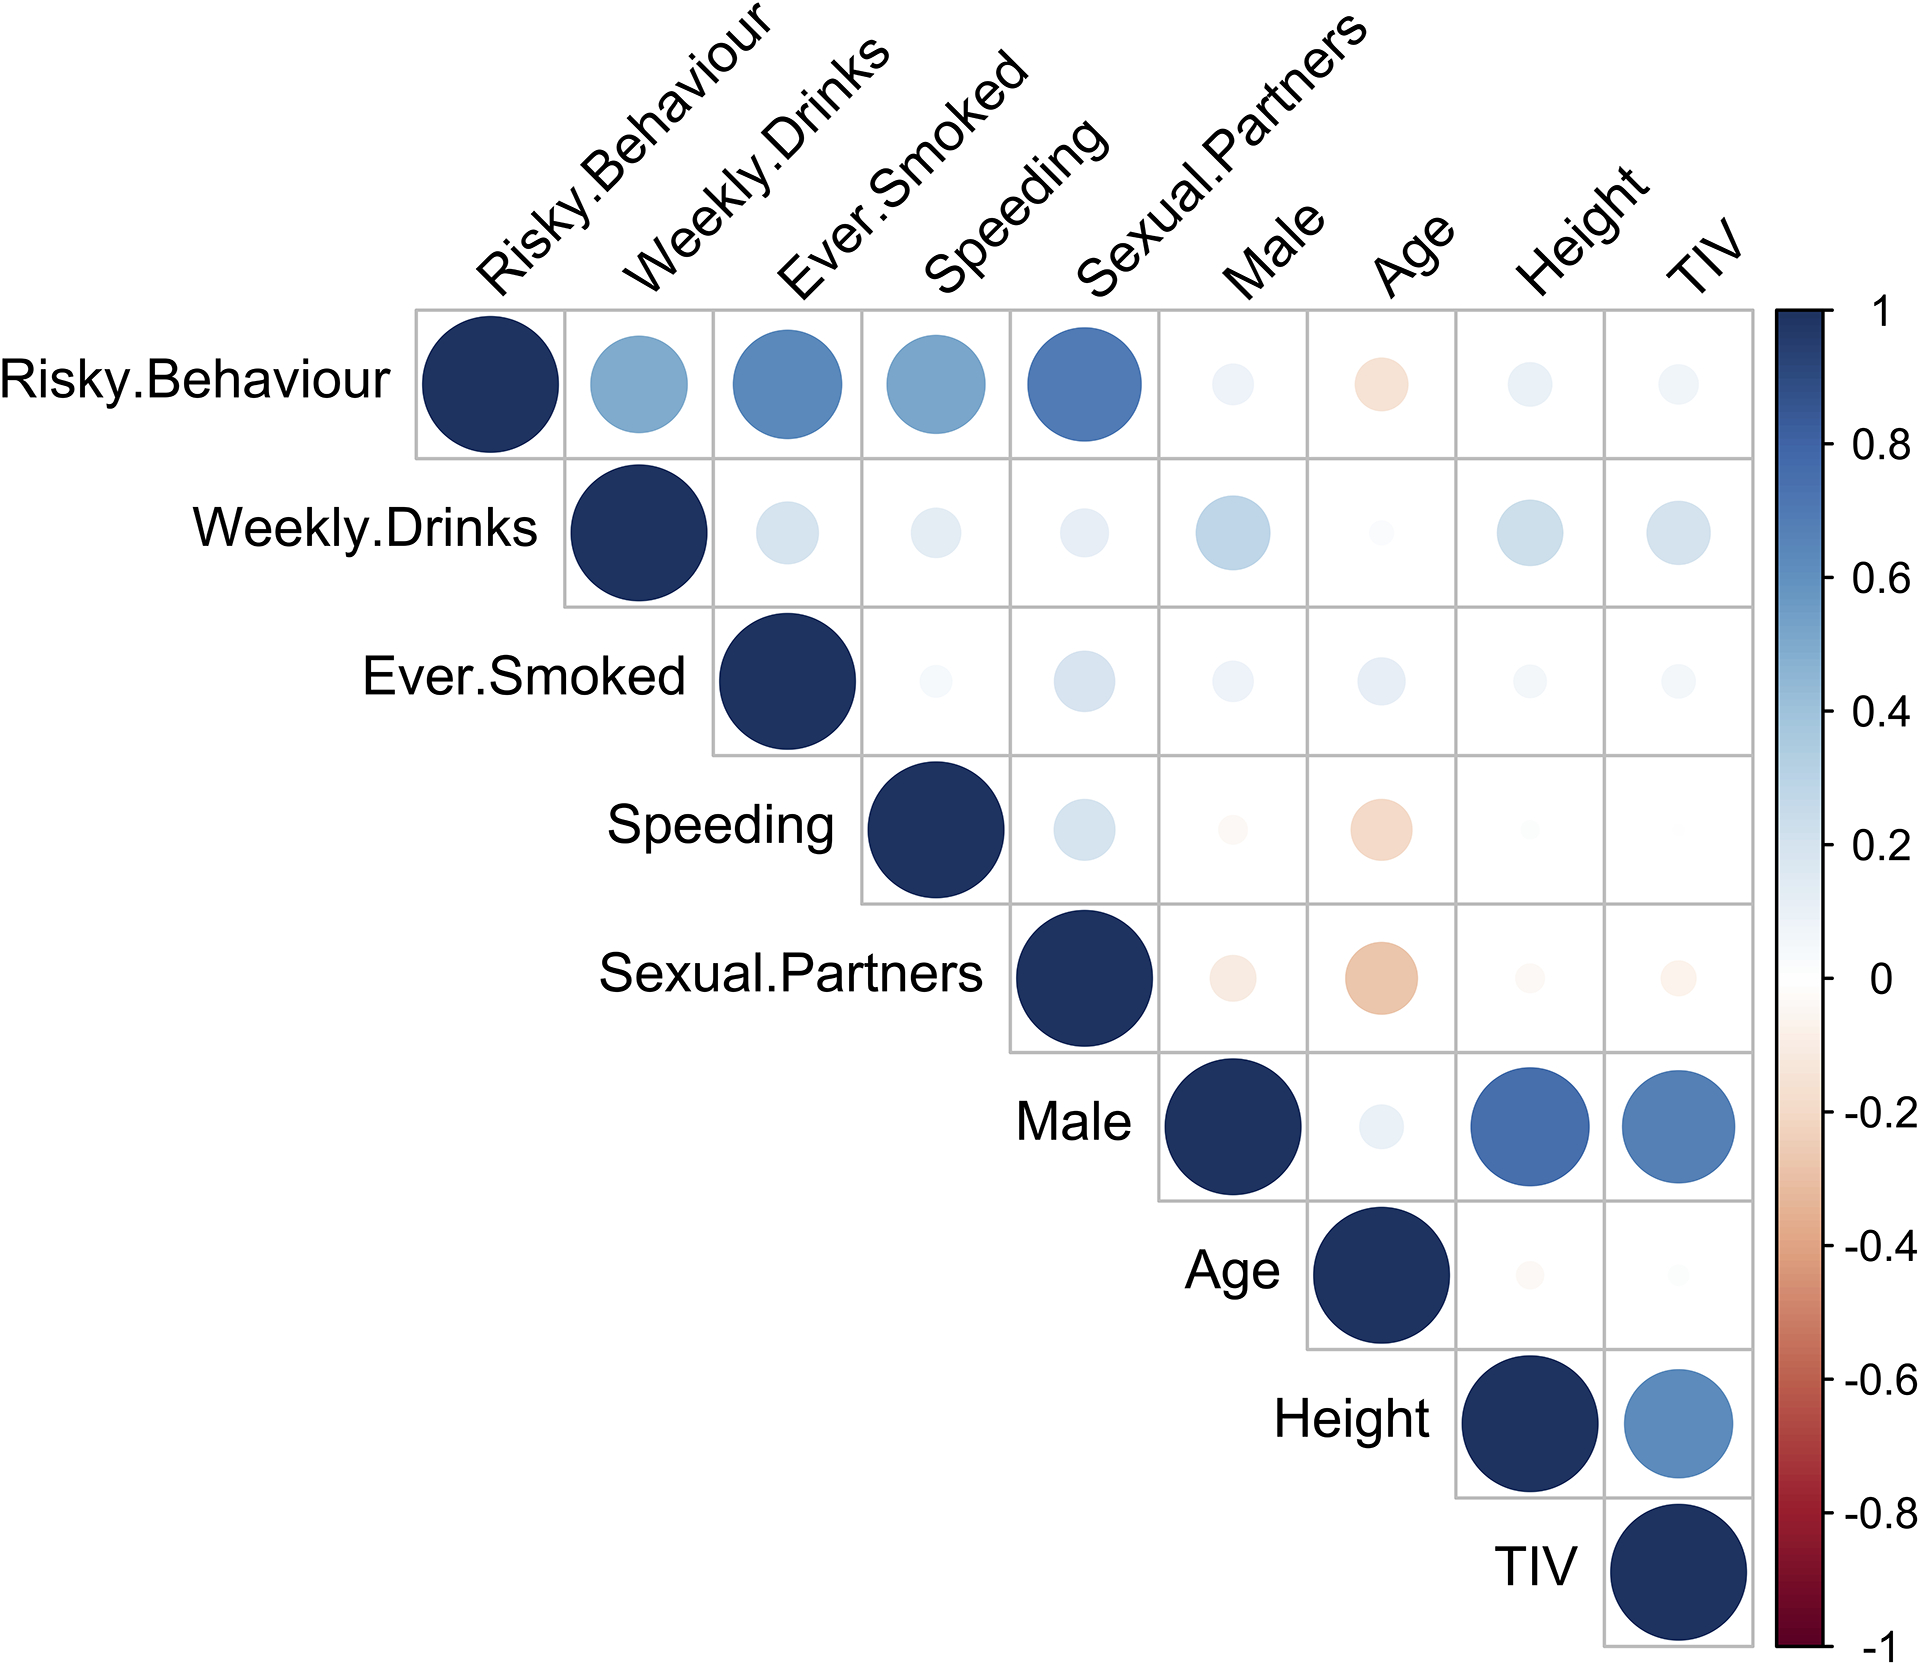
Bivariate correlations between variables used in the main study sample (N = 12,675).
Extended Data Fig. 2:
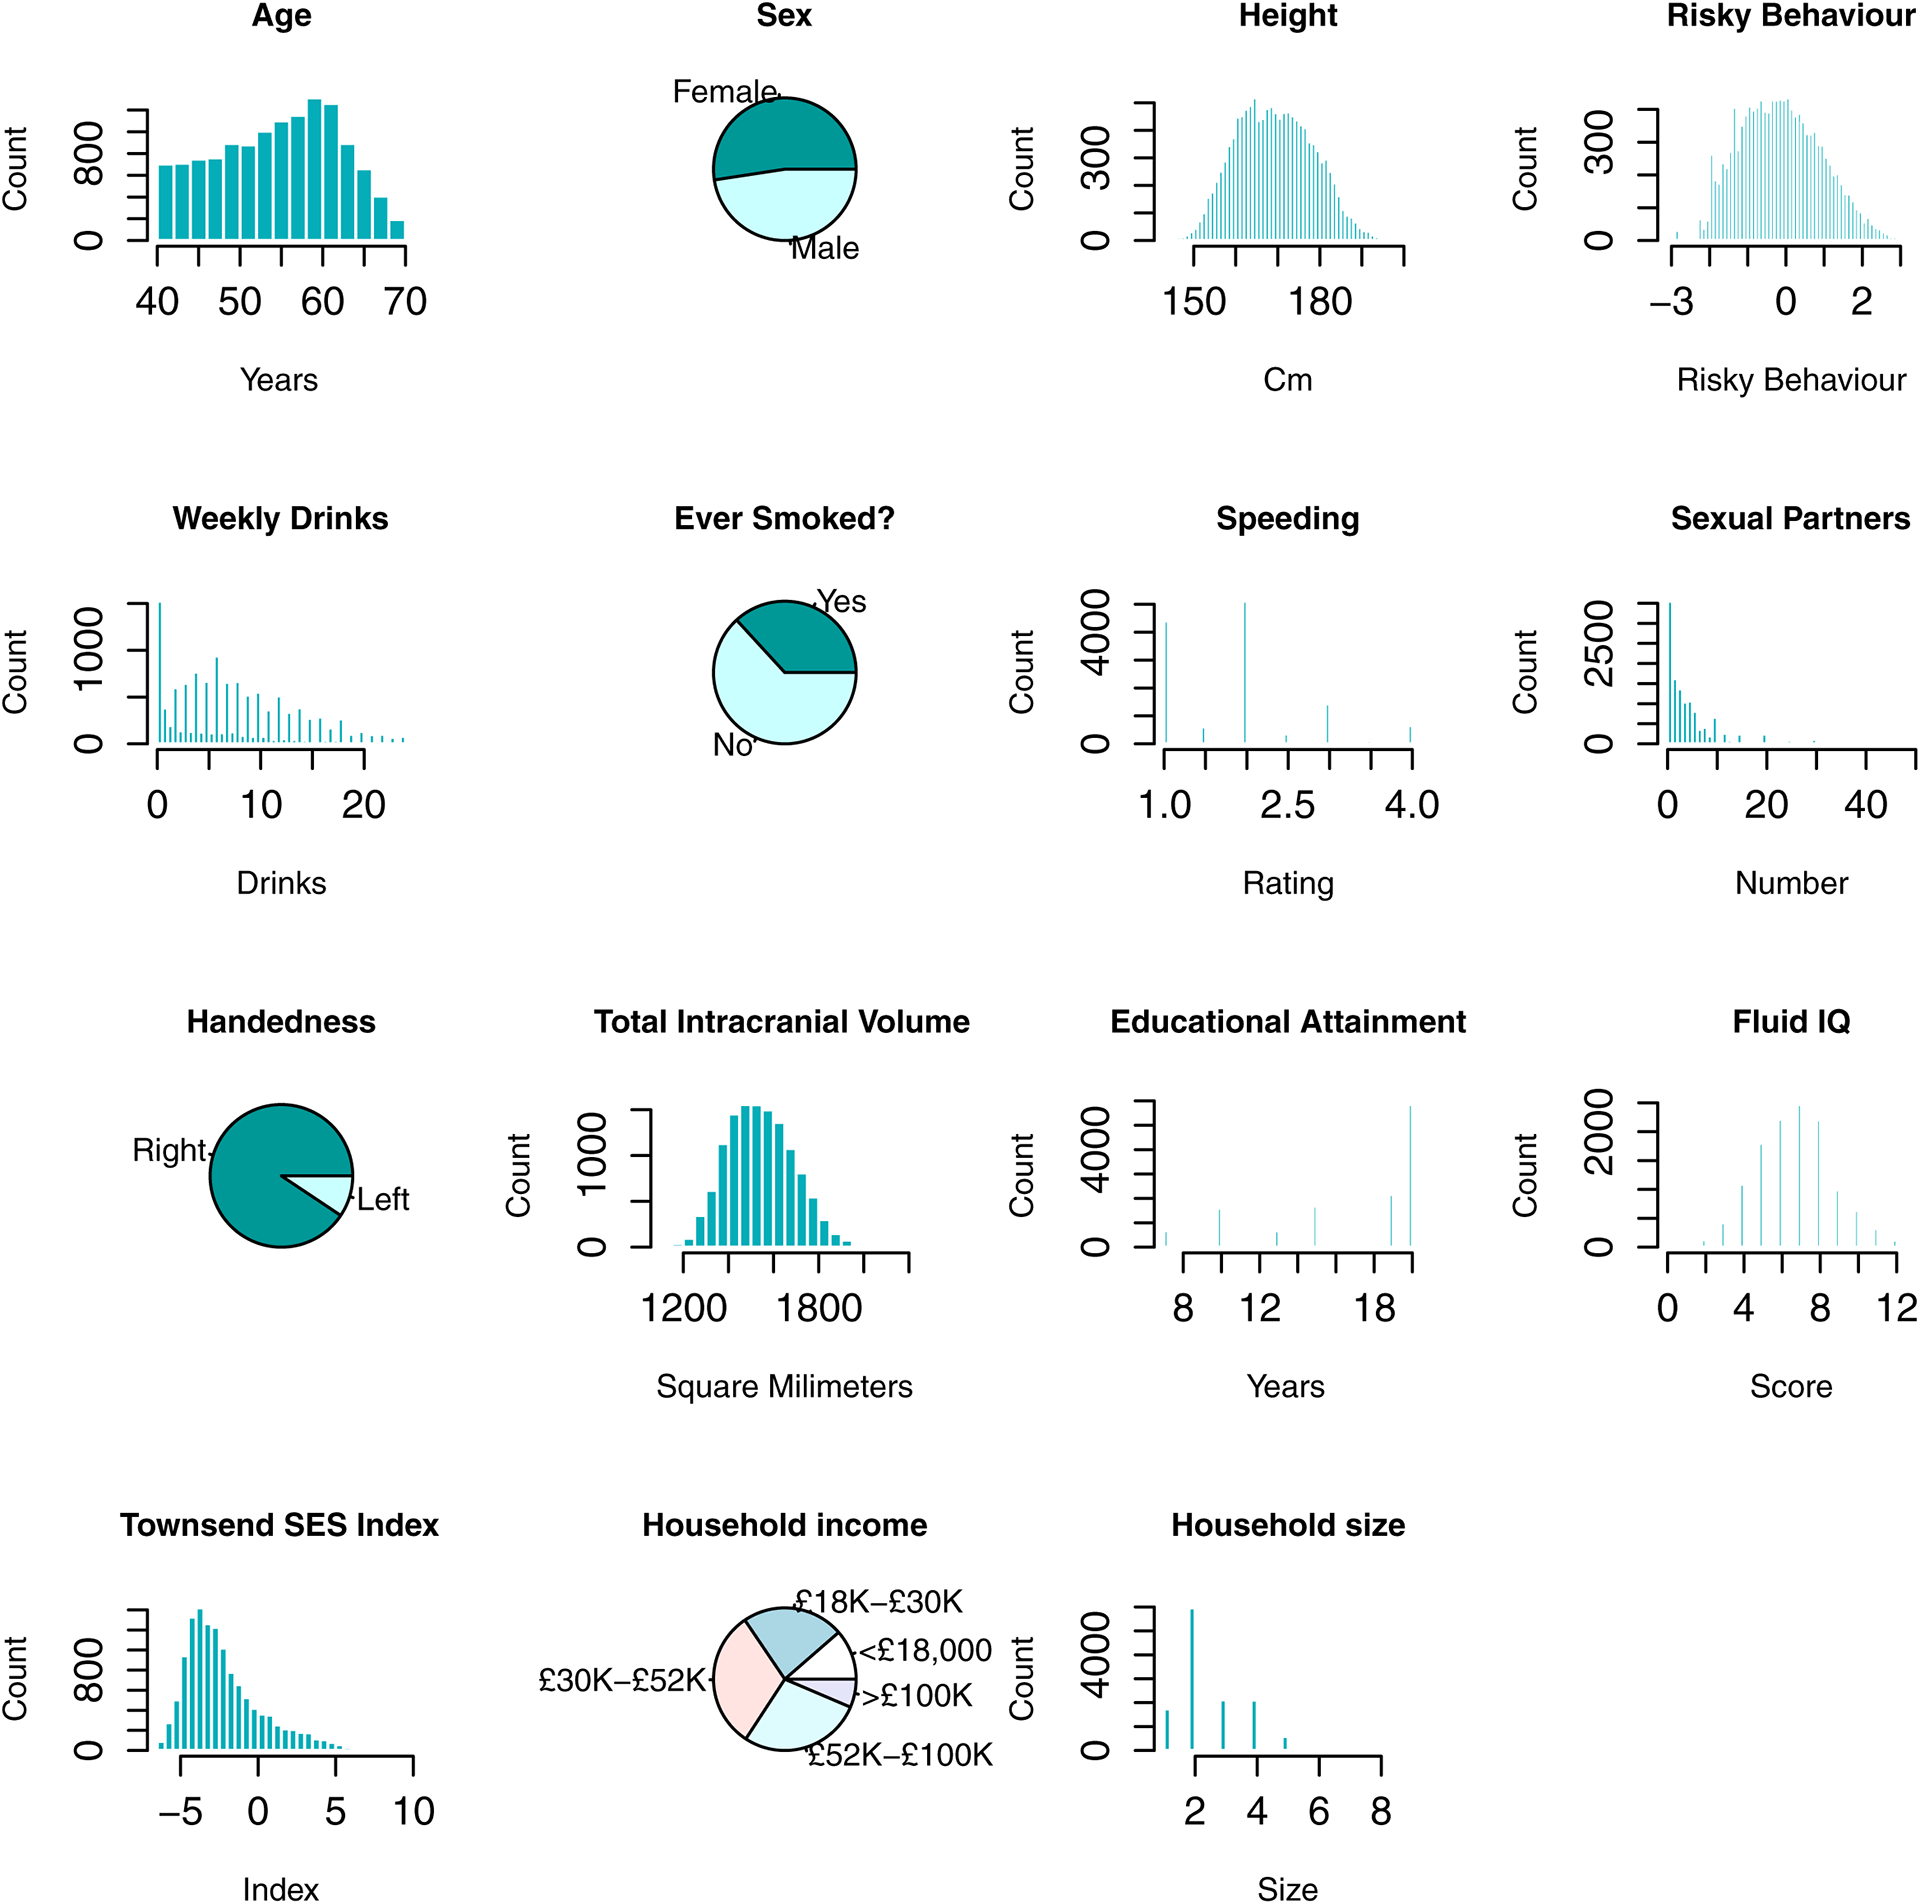
Empirical distributions of variables in the replication sample (N = 13,004).
Extended Data Fig. 3:
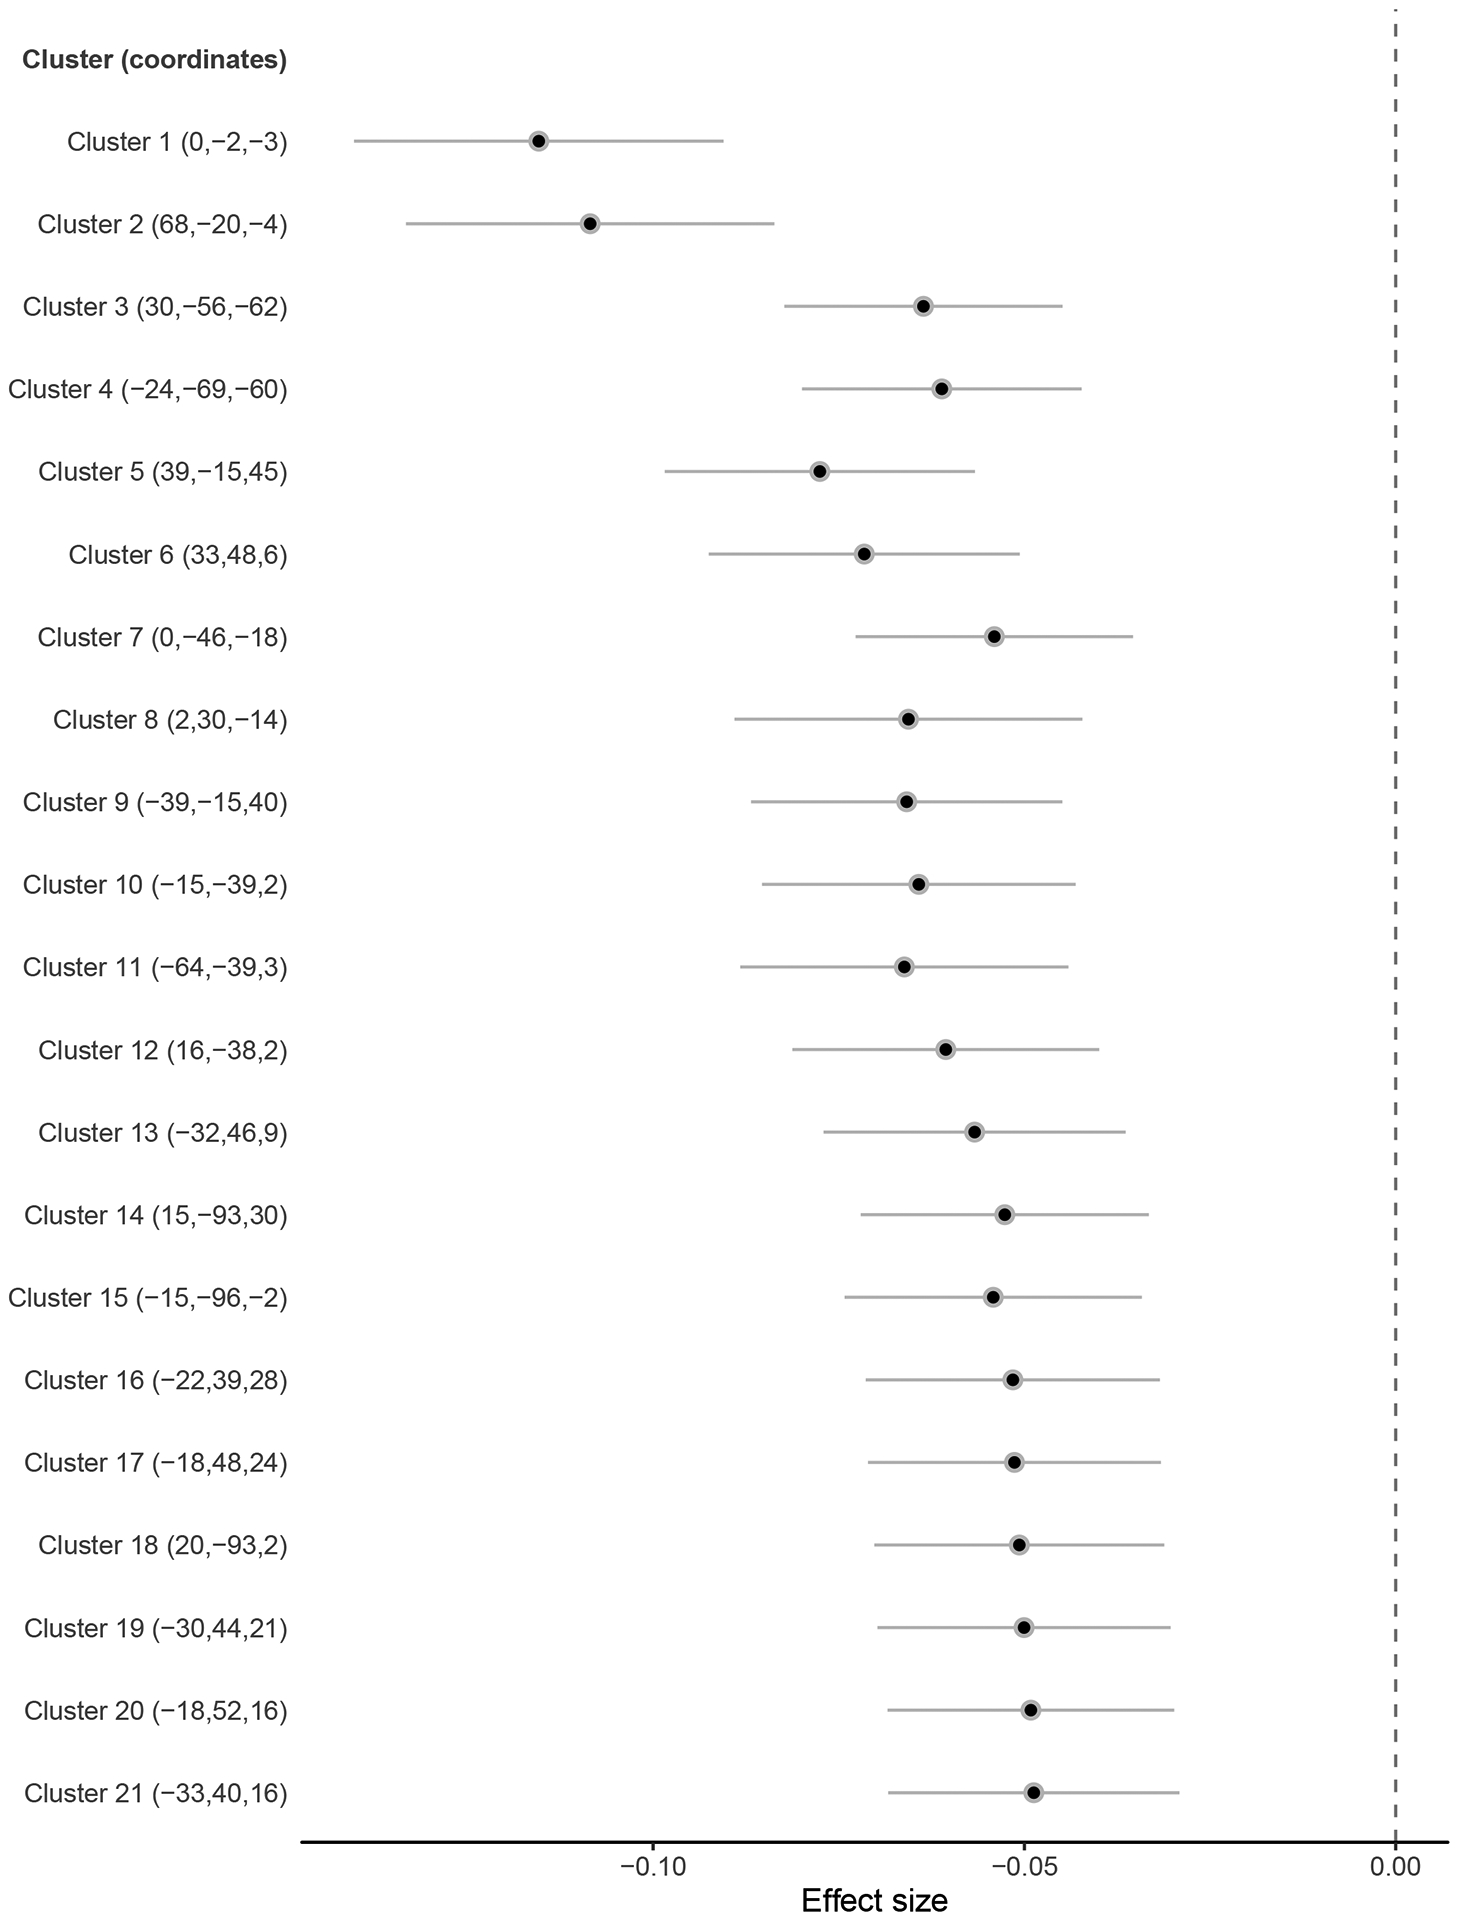
Effect sizes (standardized betas) of associations between risky behaviour and grey matter volume (GMV) in voxel clusters showing significant associations at P < .01 (FWE-corrected) (N = 12,675).
Extended Data Fig. 4:
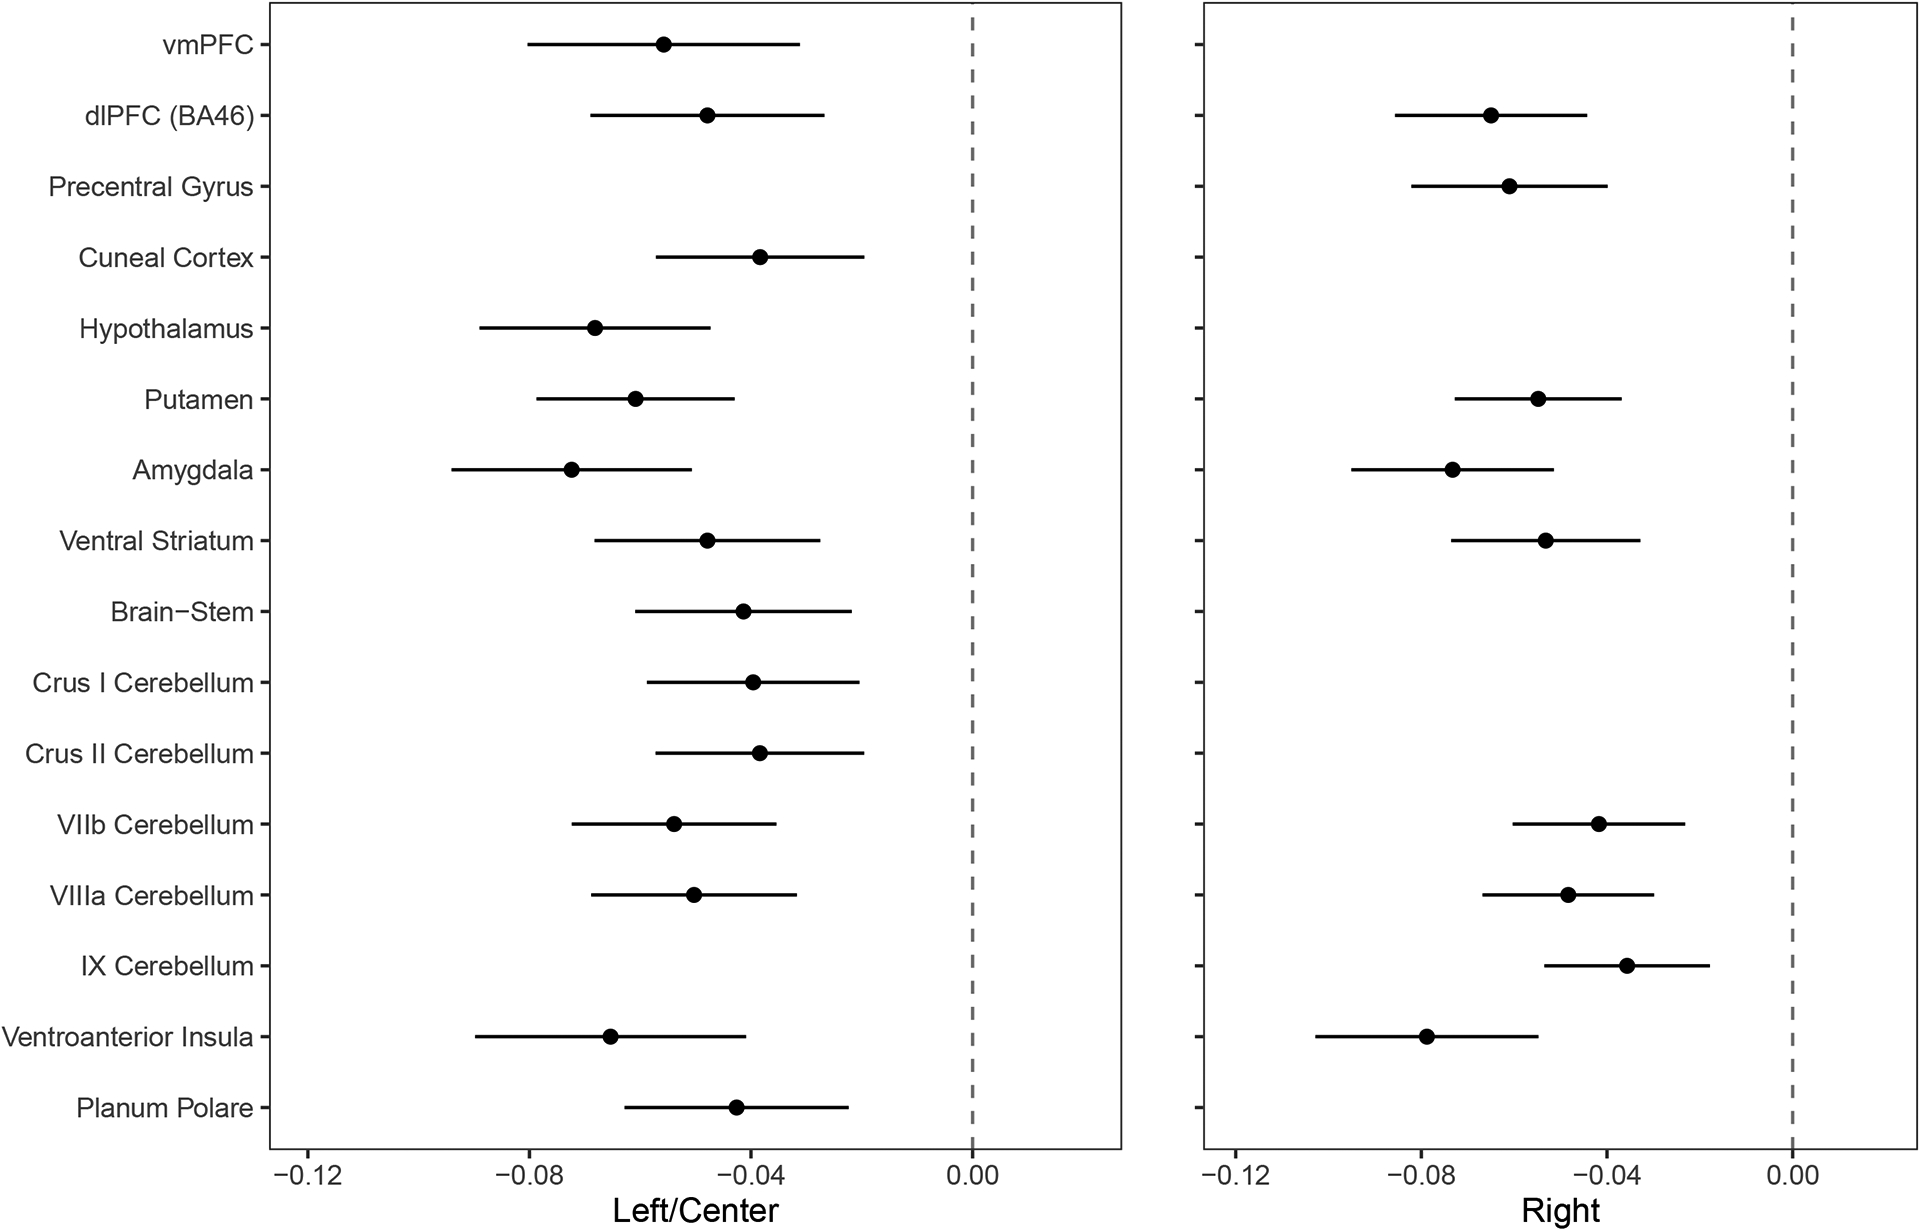
Effect sizes (standardized betas) of association between risky behaviour and IDPs of grey matter volume (GMV) showing significant associations at P<0.01 level (FWE-corrected) (N = 12,675).
Extended Data Fig. 5:
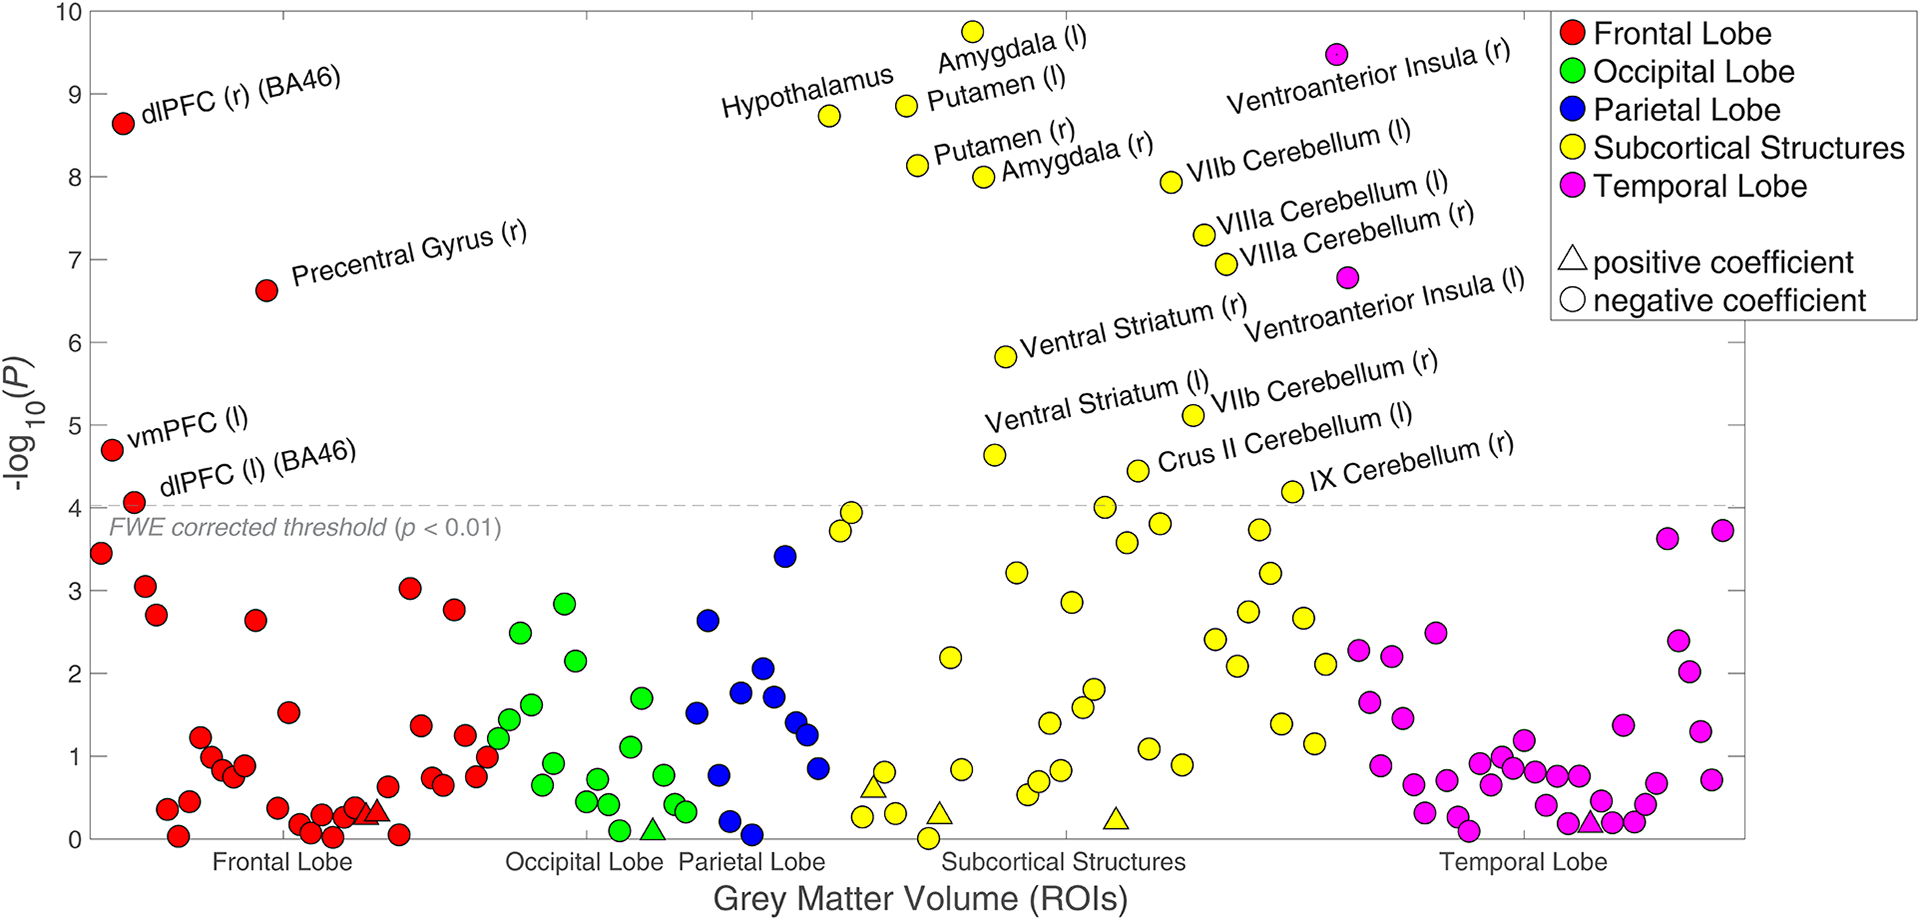
Associations (p-values) between risky behaviour and 148 ROI-level imaging-derived phenotypes (IDPs) of grey matter volume (GMV), controlling for cognitive and socioeconomic outcomes (N = 11,864).
Extended Data Fig. 6:
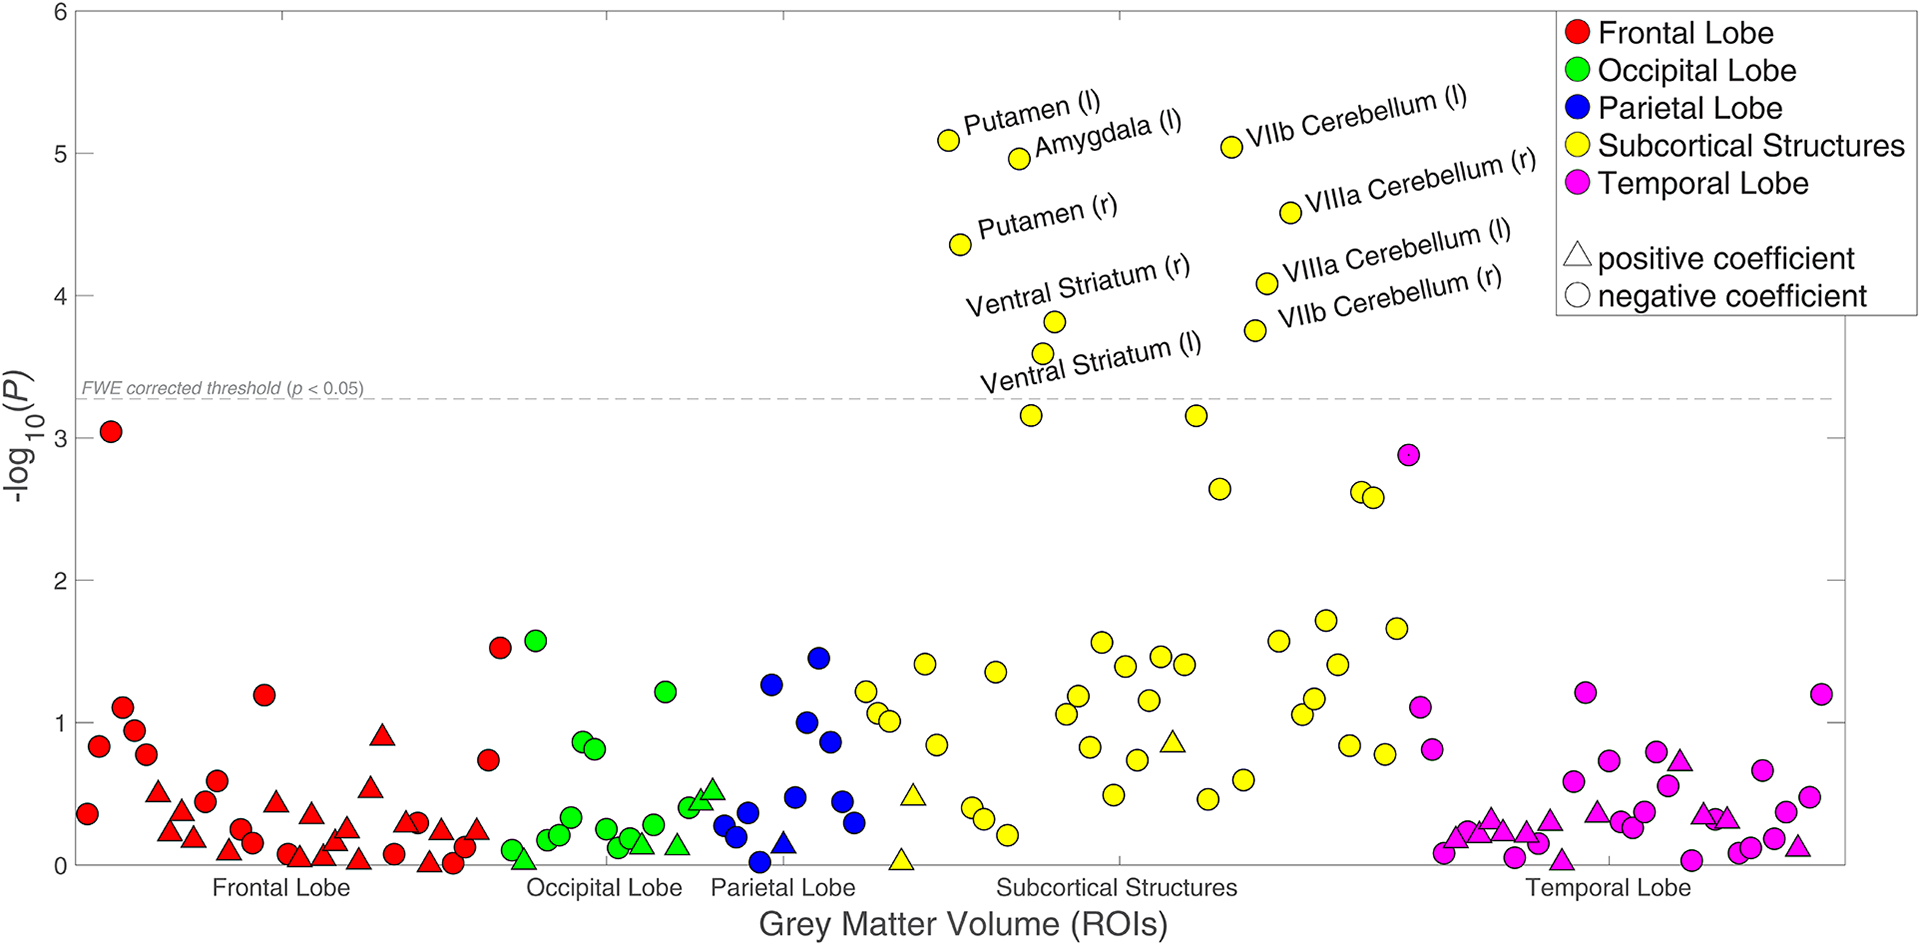
Associations (p-values) between risky behaviour and 148 ROI-level imaging-derived phenotypes (IDPs) of grey matter volume (GMV), controlling for current drinking levels (binned in deciles) and smoking levels (binned in 3 categories) in addition to all standard controls (N = 12,675).
Extended Data Fig. 7:
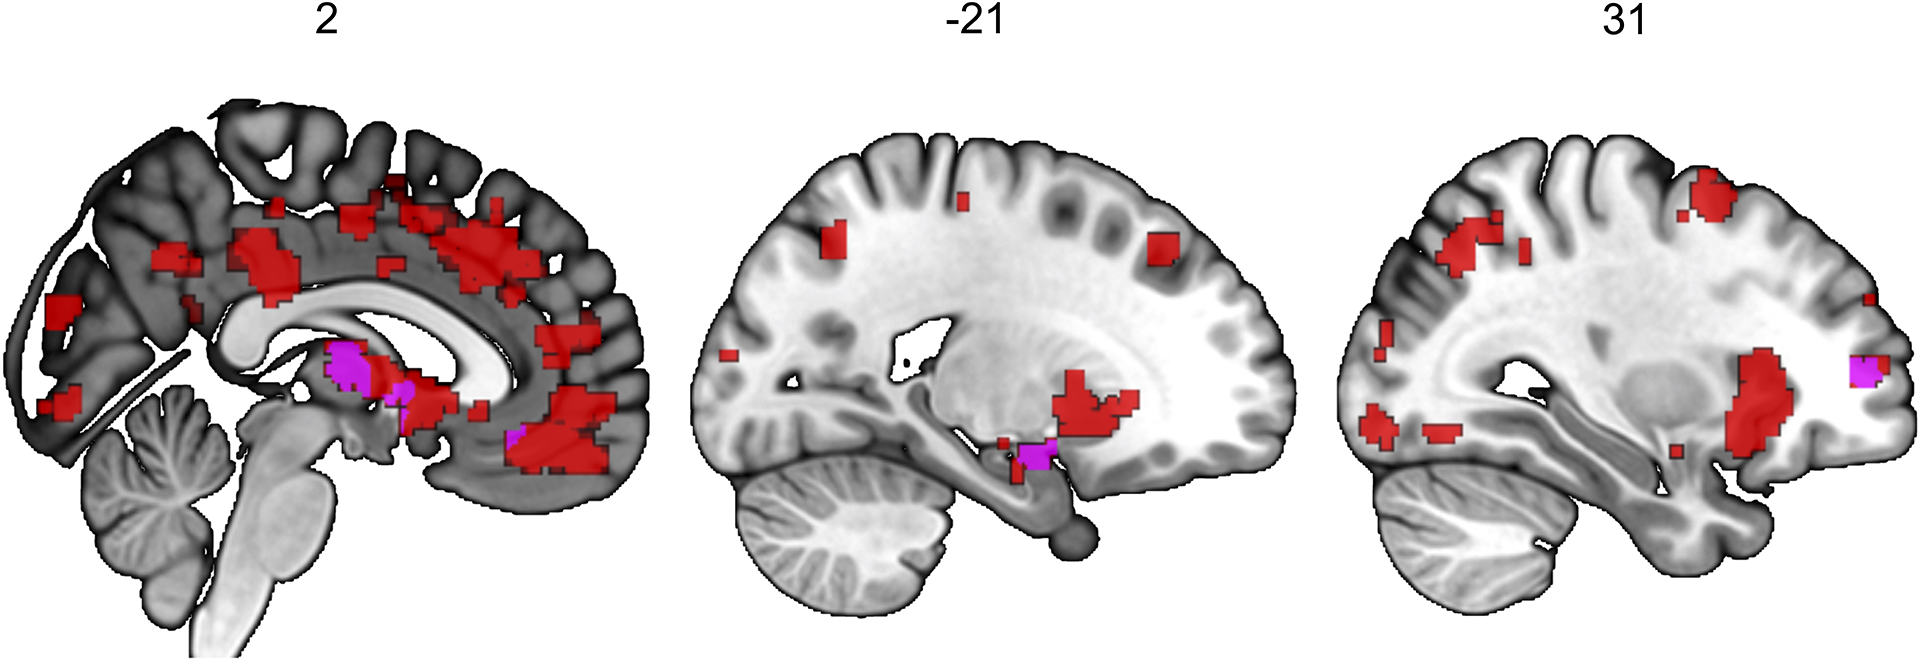
Meta-analysis of functional MRI studies of risky behaviours, provided by Neurosynth (N = 4,717 participants and K = 101 studies).
Extended Data Fig. 8:

Mediation analysis of the association between PRS and risky behaviour with GMV in dlPFC, putamen and hypothalamus (N = 12,675).
Supplementary Material
Acknowledgments
This research was carried out under the auspices of the Brain Imaging and Genetics in Behavioural Research (https://big-bear-research.org/) consortium. The authors thank Nadja C. Furtner for helpful comments and Dylan Manfredi for research assistance. The research was conducted using UK Biobank resources under application 40830. The study was supported by funding from an NSF Early Career Development Program grant (1942917) and The Wharton School Dean’s Research fund to G.N., an ERC Consolidator Grant to P.D.K. (647648 EdGe), and a Swiss National Science Foundation grant to C.C.R (100019L_173248). R.R.W. was financially supported by NIAAA K23 grant (K23 AA023894) and H.R.K. was supported by NIDA grant P30 DA046345. G.N. thanks Carlos and Rosa de la Cruz for ongoing support. The work was carried out on the Dutch national e-infrastructure with the support of the SURF Cooperative. The funders had no role in study design, data collection and analysis, decision to publish or preparation of the manuscript. Data can be accessed via the UKBiobank, and data analysis scripts are available on OSF (https://osf.io/qkp4g/).
Competing interests
Dr. Kranzler is a member of an advisory board for Dicerna Pharmaceuticals; a member of the American Society of Clinical Psychopharmacology’s Alcohol Clinical Trials Initiative, which was sponsored in the past three years by AbbVie, Alkermes, Amygdala Neurosciences, Arbor Pharmaceuticals, Ethypharm, Indivior, Lilly, Lundbeck, Otsuka, and Pfizer; and is named as an inventor on PCT patent application #15/878,640 entitled: “Genotype-guided dosing of opioid agonists,” filed January 24, 2018. All other authors declare no competing interests.
Footnotes
Code Availability
The analysis code used in this study is publicly available on https://osf.io/qkp4g/.
Data Availability
Data and materials are available via UK Biobank at http://www.ukbiobank.ac.uk/.
References
- 1.Knight FH Risk, Uncertainty, and Profit (Houghton Mifflin, 1921). [Google Scholar]
- 2.Eckel CC & Füllbrunn SC Thar SHE Blows? Gender, Competition, and Bubbles in Experimental Asset Markets. American Economic Review 105(2), 906–920 (2015). [Google Scholar]
- 3.Centers for Disease Control and Prevention. Incidence, Prevalence, and Cost of Sexually Transmitted Infections in the United States. https://www.cdc.gov/std/stats/sti-estimates-fact-sheet-feb-2013.pdf (2013).
- 4.Sacks JJ, Gonzales KR, Bouchery EE, Tomedi LE & Brewer RD 2010 National and State Costs of Excessive Alcohol Consumption. Am. J. Prev. Med 49(5), e73–e79 (2015). [DOI] [PubMed] [Google Scholar]
- 5.Blincoe L, Miller TR, Zaloshnja E & Lawrence BA The economic and societal impact of motor vehicle crashes, 2010 (Revised). https://trid.trb.org/view/1311862 (2015).
- 6.U.S. Department of Health and Human Services. The Health Consequences of Smoking: 50 Years of Progress. A Report of the Surgeon General. Atlanta, GA: U.S. Department of Health and Human Services, Centers for Disease Control and Prevention, National Center for Chronic Disease Prevention and Health Promotion, Office on Smoking and Health; (2014). [Google Scholar]
- 7.Linner RK et al. Genome-wide association analyses of risk tolerance and risky behaviors in over 1 million individuals identify hundreds of loci and shared genetic influences. Nat. Genet 51, 245–257 (2019). [DOI] [PMC free article] [PubMed] [Google Scholar]
- 8.Elliott LT et al. Genome-wide association studies of brain imaging phenotypes in UK Biobank. Nature 562, 210–216 (2018). [DOI] [PMC free article] [PubMed] [Google Scholar]
- 9.Thompson PM et al. Genetic influences on brain structure. Nat. Neurosci 4, 1253–1258 (2001). [DOI] [PubMed] [Google Scholar]
- 10.Grubb MA, Tymula A, Gilaie-Dotan S, Glimcher PW & Levy I Neuroanatomy accounts for age-related changes in risk preferences. Nat. Commun 7, 13822 (2016). [DOI] [PMC free article] [PubMed] [Google Scholar]
- 11.Jung WH, Lee S, Lerman C & Kable JW Amygdala Functional and Structural Connectivity Predicts Individual Risk Tolerance. Neuron 98(2), 394–404.e4 (2018). [DOI] [PMC free article] [PubMed] [Google Scholar]
- 12.Nasiriavanaki Z et al. Prediction of individual differences in risky behavior in young adults via variations in local brain structure. Front. Neurosci 9, 359 (2015). [DOI] [PMC free article] [PubMed] [Google Scholar]
- 13.Button KS et al. Power failure: why small sample size undermines the reliability of neuroscience. Nat. Rev. Neurosci 14, 365–376 (2013). [DOI] [PubMed] [Google Scholar]
- 14.Marek S et al. Towards Reproducible Brain-Wide Association Studies. Preprint at https://www.biorxiv.org/content/10.1101/2020.08.21.257758v1 (2020). [Google Scholar]
- 15.Dohmen T et al. INDIVIDUAL RISK ATTITUDES: MEASUREMENT, DETERMINANTS, AND BEHAVIORAL CONSEQUENCES. Journal of the European Economic Association 9(3), 522–550 (2011). [Google Scholar]
- 16.Cardon LR & Palmer LJ Population stratification and spurious allelic association. Lancet 361(9357), 598–604 (2003). [DOI] [PubMed] [Google Scholar]
- 17.Nave G, Jung WH, Linnér RK, Kable JW & Koellinger PD Are Bigger Brains Smarter? Evidence From a Large-Scale Preregistered Study. Psychol. Sci 30(1), 43–54 (2019). [DOI] [PubMed] [Google Scholar]
- 18.Romer D Adolescent risk taking, impulsivity, and brain development: implications for prevention. Dev. Psychobiol 52(3), 263–276 (2010). [DOI] [PMC free article] [PubMed] [Google Scholar]
- 19.Miller KL et al. Multimodal population brain imaging in the UK Biobank prospective epidemiological study. Nature Neuroscience 19, 1523–1536 (2016). [DOI] [PMC free article] [PubMed] [Google Scholar]
- 20.Sudlow C et al. UK biobank: an open access resource for identifying the causes of a wide range of complex diseases of middle and old age. PLOS Med. 12(3), e1001779 (2015). [DOI] [PMC free article] [PubMed] [Google Scholar]
- 21.Harper C The neurotoxicity of alcohol. Hum. Exp. Toxicol 26(3), 251–257 (2007). [DOI] [PubMed] [Google Scholar]
- 22.Daviet R et al. Multimodal brain imaging study of 19,825 participants reveals adverse effects of moderate drinking. Preprint at https://www.biorxiv.org/content/10.1101/2020.03.27.011791v1 (2020). [Google Scholar]
- 23.Kranzler HR et al. Topiramate Treatment for Heavy Drinkers: Moderation by a GRIK1Polymorphism. American Journal of Psychiatry 171(4), 445–452 (2014). [DOI] [PMC free article] [PubMed] [Google Scholar]
- 24.Ashburner J & Friston KJ Voxel-Based Morphometry—The Methods. Neuroimage 11(6), 805–821 (2000). [DOI] [PubMed] [Google Scholar]
- 25.Botvinik-Nezer R et al. Variability in the analysis of a single neuroimaging dataset by many teams. Nature 582, 84–88 (2020). [DOI] [PMC free article] [PubMed] [Google Scholar]
- 26.Alfaro-Almagro F et al. Image processing and Quality Control for the first 10,000 brain imaging datasets from UK Biobank. Neuroimage 166, 400–424 (2018). [DOI] [PMC free article] [PubMed] [Google Scholar]
- 27.Bycroft C et al. The UK Biobank resource with deep phenotyping and genomic data. Nature 562, 203–209 (2018). [DOI] [PMC free article] [PubMed] [Google Scholar]
- 28.Hill WD et al. Molecular Genetic Contributions to Social Deprivation and Household Income in UK Biobank. Curr. Biol 26(22), 3083–3089 (2016). [DOI] [PMC free article] [PubMed] [Google Scholar]
- 29.Masouleh SK, Eickhoff SB, Hoffstaedter F, Genon S & Alzheimer’s Disease Neuroimaging Initiative. Empirical examination of the replicability of associations between brain structure and psychological variables. eLife 8, e43464 (2019). [DOI] [PMC free article] [PubMed] [Google Scholar]
- 30.Yarkoni T, Poldrack RA, Nichols TE, Van Essen DC & Wager TD Large-scale automated synthesis of human functional neuroimaging data. Nat. Methods 8, 665–670 (2011). [DOI] [PMC free article] [PubMed] [Google Scholar]
- 31.Mohr PNC, Biele G & Heekeren HR Neural processing of risk. J. Neurosci 30(19), 6613–6619 (2010). [DOI] [PMC free article] [PubMed] [Google Scholar]
- 32.Wu CC, Sacchet MD & Knutson B Toward an affective neuroscience account of financial risk taking. Front. Neurosci 6, 159 (2012). [DOI] [PMC free article] [PubMed] [Google Scholar]
- 33.Schonberg T, Fox CR & Poldrack RA Mind the gap: bridging economic and naturalistic risk-taking with cognitive neuroscience. Trends Cogn. Sci 15(1), 11–19 (2011). [DOI] [PMC free article] [PubMed] [Google Scholar]
- 34.Kable JW & Levy I Neural markers of individual differences in decision-making. Curr. Opin. Behav. Sci 5, 100–107 (2015). [DOI] [PMC free article] [PubMed] [Google Scholar]
- 35.Chang LJ, Yarkoni T, Khaw MW & Sanfey AG Decoding the role of the insula in human cognition: functional parcellation and large-scale reverse inference. Cereb. Cortex 23(3), 739–749 (2013). [DOI] [PMC free article] [PubMed] [Google Scholar]
- 36.Evans BE, Greaves-Lord K, Euser AS, Franken IHA & Huizink AC The relation between hypothalamic-pituitary-adrenal (HPA) axis activity and age of onset of alcohol use. Addiction 107(2), 312–322 (2012). [DOI] [PubMed] [Google Scholar]
- 37.Kreek MJ, Nielsen DA, Butelman ER & LaForge KS Genetic influences on impulsivity, risk taking, stress responsivity and vulnerability to drug abuse and addiction. Nat. Neurosci 8(11), 1450–1457 (2005). [DOI] [PubMed] [Google Scholar]
- 38.O’Doherty J et al. Dissociable roles of ventral and dorsal striatum in instrumental conditioning. Science 304(5669), 452–454 (2004). [DOI] [PubMed] [Google Scholar]
- 39.Dosenbach NUF, Fair DA, Cohen AL, Schlaggar BL & Petersen SE A dual-networks architecture of top-down control. Trends Cogn. Sci 12(3), 99–105 (2008). [DOI] [PMC free article] [PubMed] [Google Scholar]
- 40.Ivanov I, Schulz KP, London ED & Newcorn JH Inhibitory control deficits in childhood and risk for substance use disorders: a review. Am. J. Drug Alcohol Abuse 34(3), 239–258 (2008). (Comma after volume number should be bold. Issue number is missing.) [DOI] [PubMed] [Google Scholar]
- 41.Heilman RM, Crişan LG, Houser D, Miclea M & Miu AC Emotion regulation and decision making under risk and uncertainty. Emotion 10(2), 257–265 (2010). [DOI] [PubMed] [Google Scholar]
- 42.Tobler PN, Christopoulos GI, O’Doherty JP, Dolan RJ & Schultz W Risk-dependent reward value signal in human prefrontal cortex. Proc. Natl. Acad. Sci. U. S. A 106(17), 7185–7190 (2009). [DOI] [PMC free article] [PubMed] [Google Scholar]
- 43.Huizink AC, Ferdinand RF, Ormel J & Verhulst FC Hypothalamic-pituitary-adrenal axis activity and early onset of cannabis use. Addiction 101(11), 1581–1588 (2006). [DOI] [PubMed] [Google Scholar]
- 44.Margittai Z et al. Combined Effects of Glucocorticoid and Noradrenergic Activity on Loss Aversion. Neuropsychopharmacology 43, 334–341 (2018). [DOI] [PMC free article] [PubMed] [Google Scholar]
- 45.Grotzinger AD et al. Hair and salivary testosterone, hair cortisol, and externalizing behaviors in adolescents. Psychol. Sci 29(5), 688–699 (2018). [DOI] [PMC free article] [PubMed] [Google Scholar]
- 46.Buckner RL The cerebellum and cognitive function: 25 years of insight from anatomy and neuroimaging. Neuron 80(3), 807–815 (2013). [DOI] [PubMed] [Google Scholar]
- 47.Mechelli A, Price CJ, Friston KJ & Ashburner J Voxel-Based Morphometry of the Human Brain: Methods and Applications. Current Medical Imaging Reviews 1(2), 105–113 (2005). [Google Scholar]
- 48.Knoch D et al. Disruption of right prefrontal cortex by low-frequency repetitive transcranial magnetic stimulation induces risk-taking behavior. J. Neurosci 26(24), 6469–6472 (2006). [DOI] [PMC free article] [PubMed] [Google Scholar]
- 49.Allen Institute for Brain Science. BrainSpan atlas of the developing human brain. http://www.brainspan.org/ (2015).
- 50.Loh P et al. Efficient Bayesian mixed-model analysis increases association power in large cohorts. Nat. Genet 47, 284–290 (2015). [DOI] [PMC free article] [PubMed] [Google Scholar]
- 51.Camerer CF et al. Evaluating the replicability of social science experiments in Nature and Science between 2010 and 2015. Nat. Hum. Behav 2, 637–644 (2018). [DOI] [PubMed] [Google Scholar]
- 52.Dickie DA et al. Permutation and parametric tests for effect sizes in voxel-based morphometry of gray matter volume in brain structural MRI. Magnetic Resonance Imaging 33(10), 1299–1305 (2015). [DOI] [PMC free article] [PubMed] [Google Scholar]
Associated Data
This section collects any data citations, data availability statements, or supplementary materials included in this article.
Supplementary Materials
Data Availability Statement
Data and materials are available via UK Biobank at http://www.ukbiobank.ac.uk/.


