
Figure 1. |.
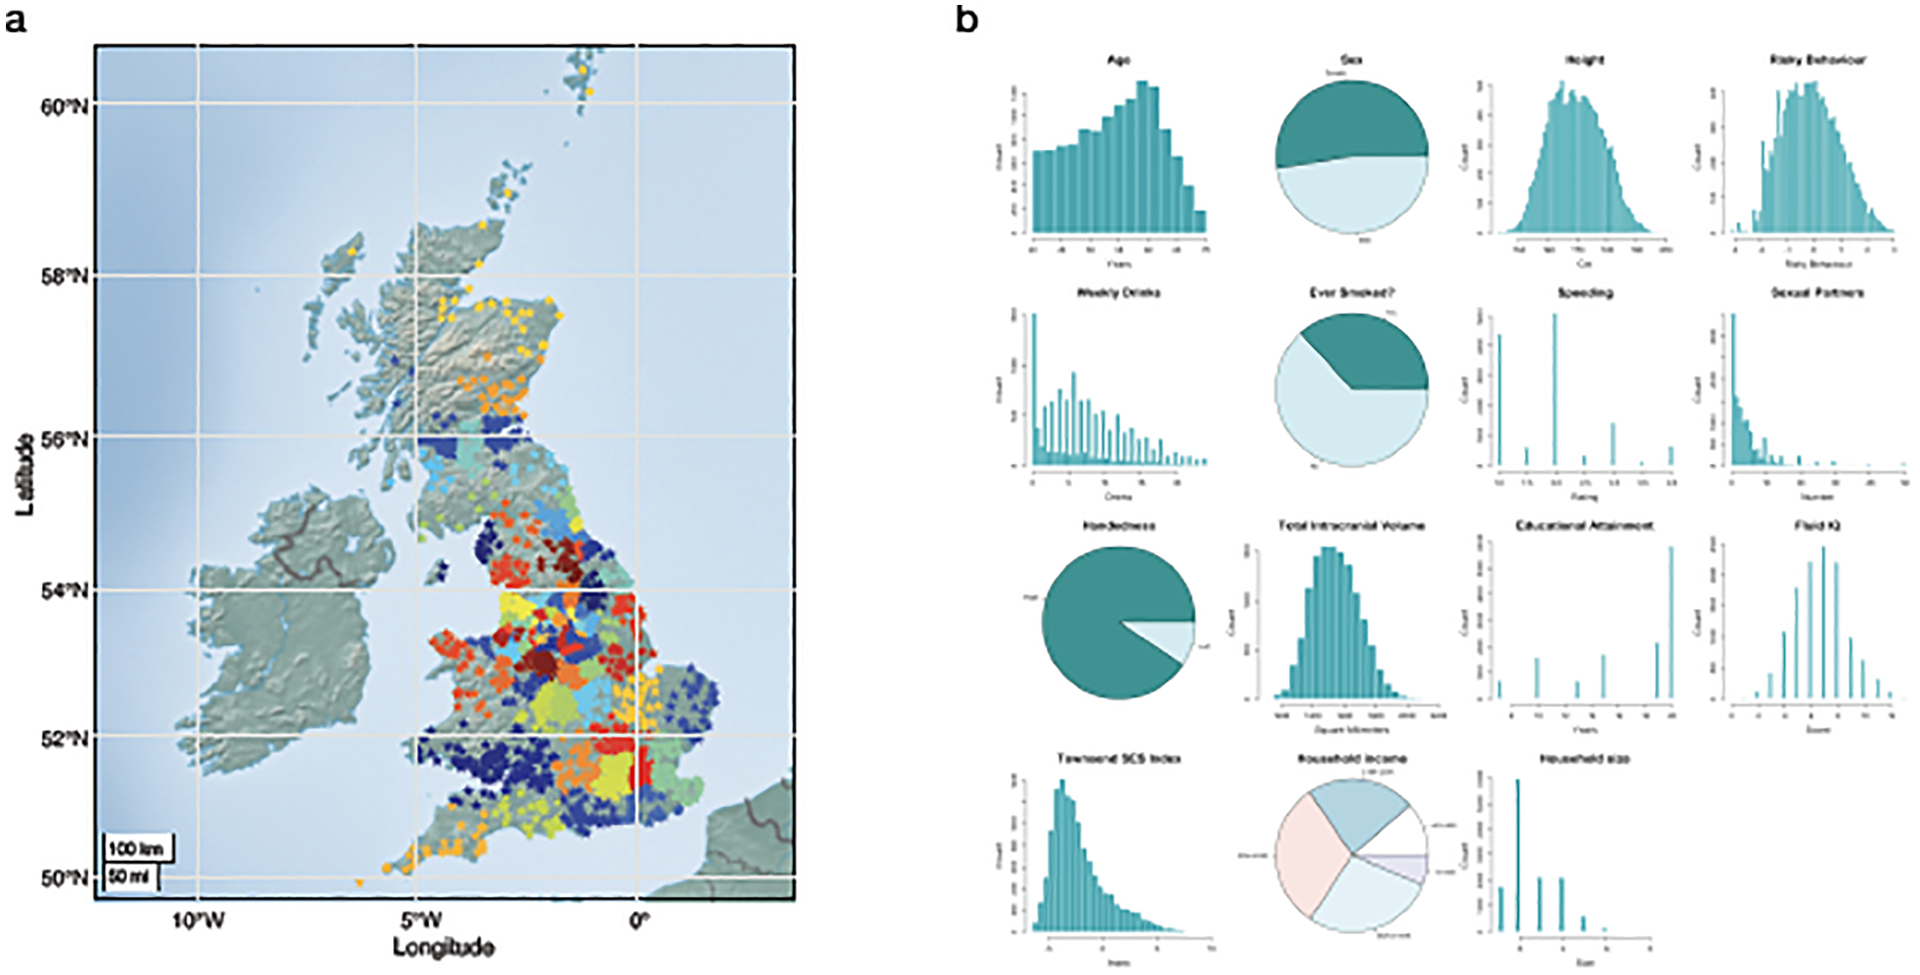
Main Sample Characteristics (N=12,675). (A) Geographical birth location clusters of the study’s participants. Each star represents the birthplace of a participant (non-jittered). Colours denote 100 geographical clusters, calculated using a k-means clustering algorithm with k = 100 and 10,000 iterations after random seeding. (B) Empirical distributions of variables in the main study sample.