Figure 2.

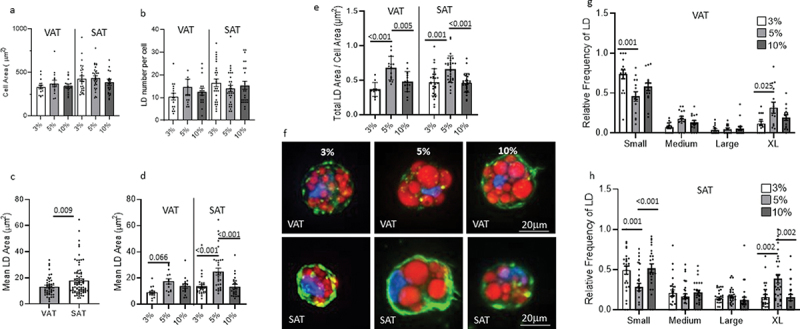
Hydrogel density regulates lipid droplet (LD) size independent of cell size or LD number.
a. Cell area (μm2) of VAT or SAT mature adipocytes differentiated for 14 d in 3%, 5%, or 10% PEG-VS gels determined by Phalloidin staining and measured using FIJI. Each data-point represents the mean cell area (μm2). No statistically significant differences were observed between experimental arms. b. Number of lipid droplets per mature adipocyte in 3%, 5%, or 10% PEG-VS gels determined by LipidTox staining and measured using FIJI. Each data-point represents the mean number of LD per cell. No statistically significant differences were observed between experimental arms. c. Mean lipid droplet area in mature adipocyte pooled from 3%, 5%, and 10% PEG-VS gels, separated by VAT and SAT. Each data-point represents the mean LD area per cell. Statistically significant differences between experimental arms denoted by p-values over indicated bars (ANOVA). d. Mean lipid droplet area in mature adipocyte in 3%, 5%, or 10% PEG-VS gels and separated by VAT and SAT. Each data-point represents the mean LD area per cell. Statistically significant differences between experimental arms denoted by p-values over indicated bars (ANOVA, Tukey’s multiple comparisons test). e. Total lipid droplet area/cell area as a measure of lipid density in adipocytes, in 3%, 5%, or 10% PEG-VS gels, separated by VAT and SAT. Statistically significant differences between experimental arms denoted by p-values over indicated bars (ANOVA, Tukey’s multiple comparison test). f. Representative confocal microscopy images of mature adipocytes in PEG-VS gels. g, h. Size frequency distribution of lipid droplet area in adipocytes differentiated for 14 d in 3%, 5%, or 10% PEG-VS gels quantified using confocal microscopy and FIJI. Small, Medium, Large, and X-Large droplets defined as <9.2 mM2, 9.2-14.5 mM2, 14.6-18.6 mM2, >18.6 mM2, respectively, for VAT, and <9.8 mM2, 9.8-14.7 mM2, 14.8-22.6 mM2, >22.6 mM2, respectively, for SAT. Each data-point represents the relative frequency of that size LD per cell. Statistically significant differences between experimental arms denoted by p-values over indicated bars (ANOVA, Tukey’s multiple comparison test). Data from 7 to 8 cells per patient from four patients, 2 M, 2F.
