. 2023 Sep 5;14(39):10664–10670. doi: 10.1039/d3sc03678b

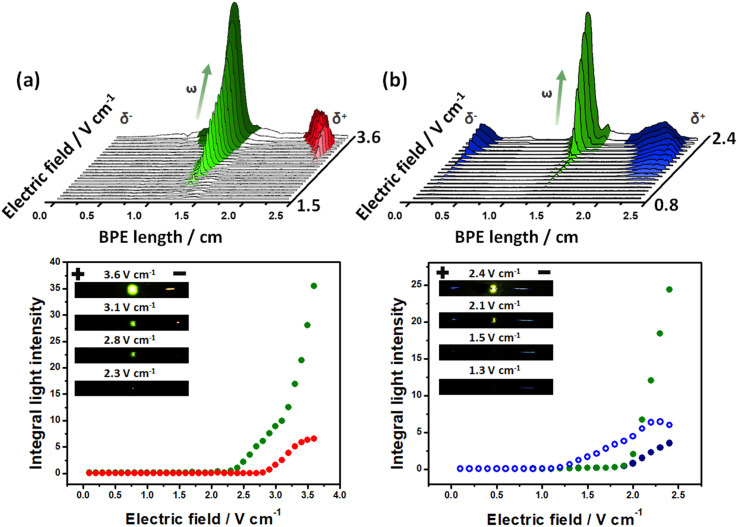
Fig. 1. ECL and LED light generated by the exogenous multimodal devices. 3D representation of the light intensity profiles (top) and integrals of the light intensity (bottom) as a function of the imposed electric field obtained by using (a) an Au-LED-Au device in a 5 mM PBS (pH 7.4), 1 mM Ru(bpy)32+, 100 mM TPrA solution and (b) a Fe-LED-Fe device in a 5 mM PBS (pH 7.4), 1 mM L012, 100 mM H2O2 solution. Inset: optical pictures of the corresponding exogenous multimodal light-emitting devices at different applied electric fields (indicated in the figure). Plain and empty blue dots represent the ECL emissions of L012 occurring at the cathodic and anodic poles, respectively.

Fig. 1