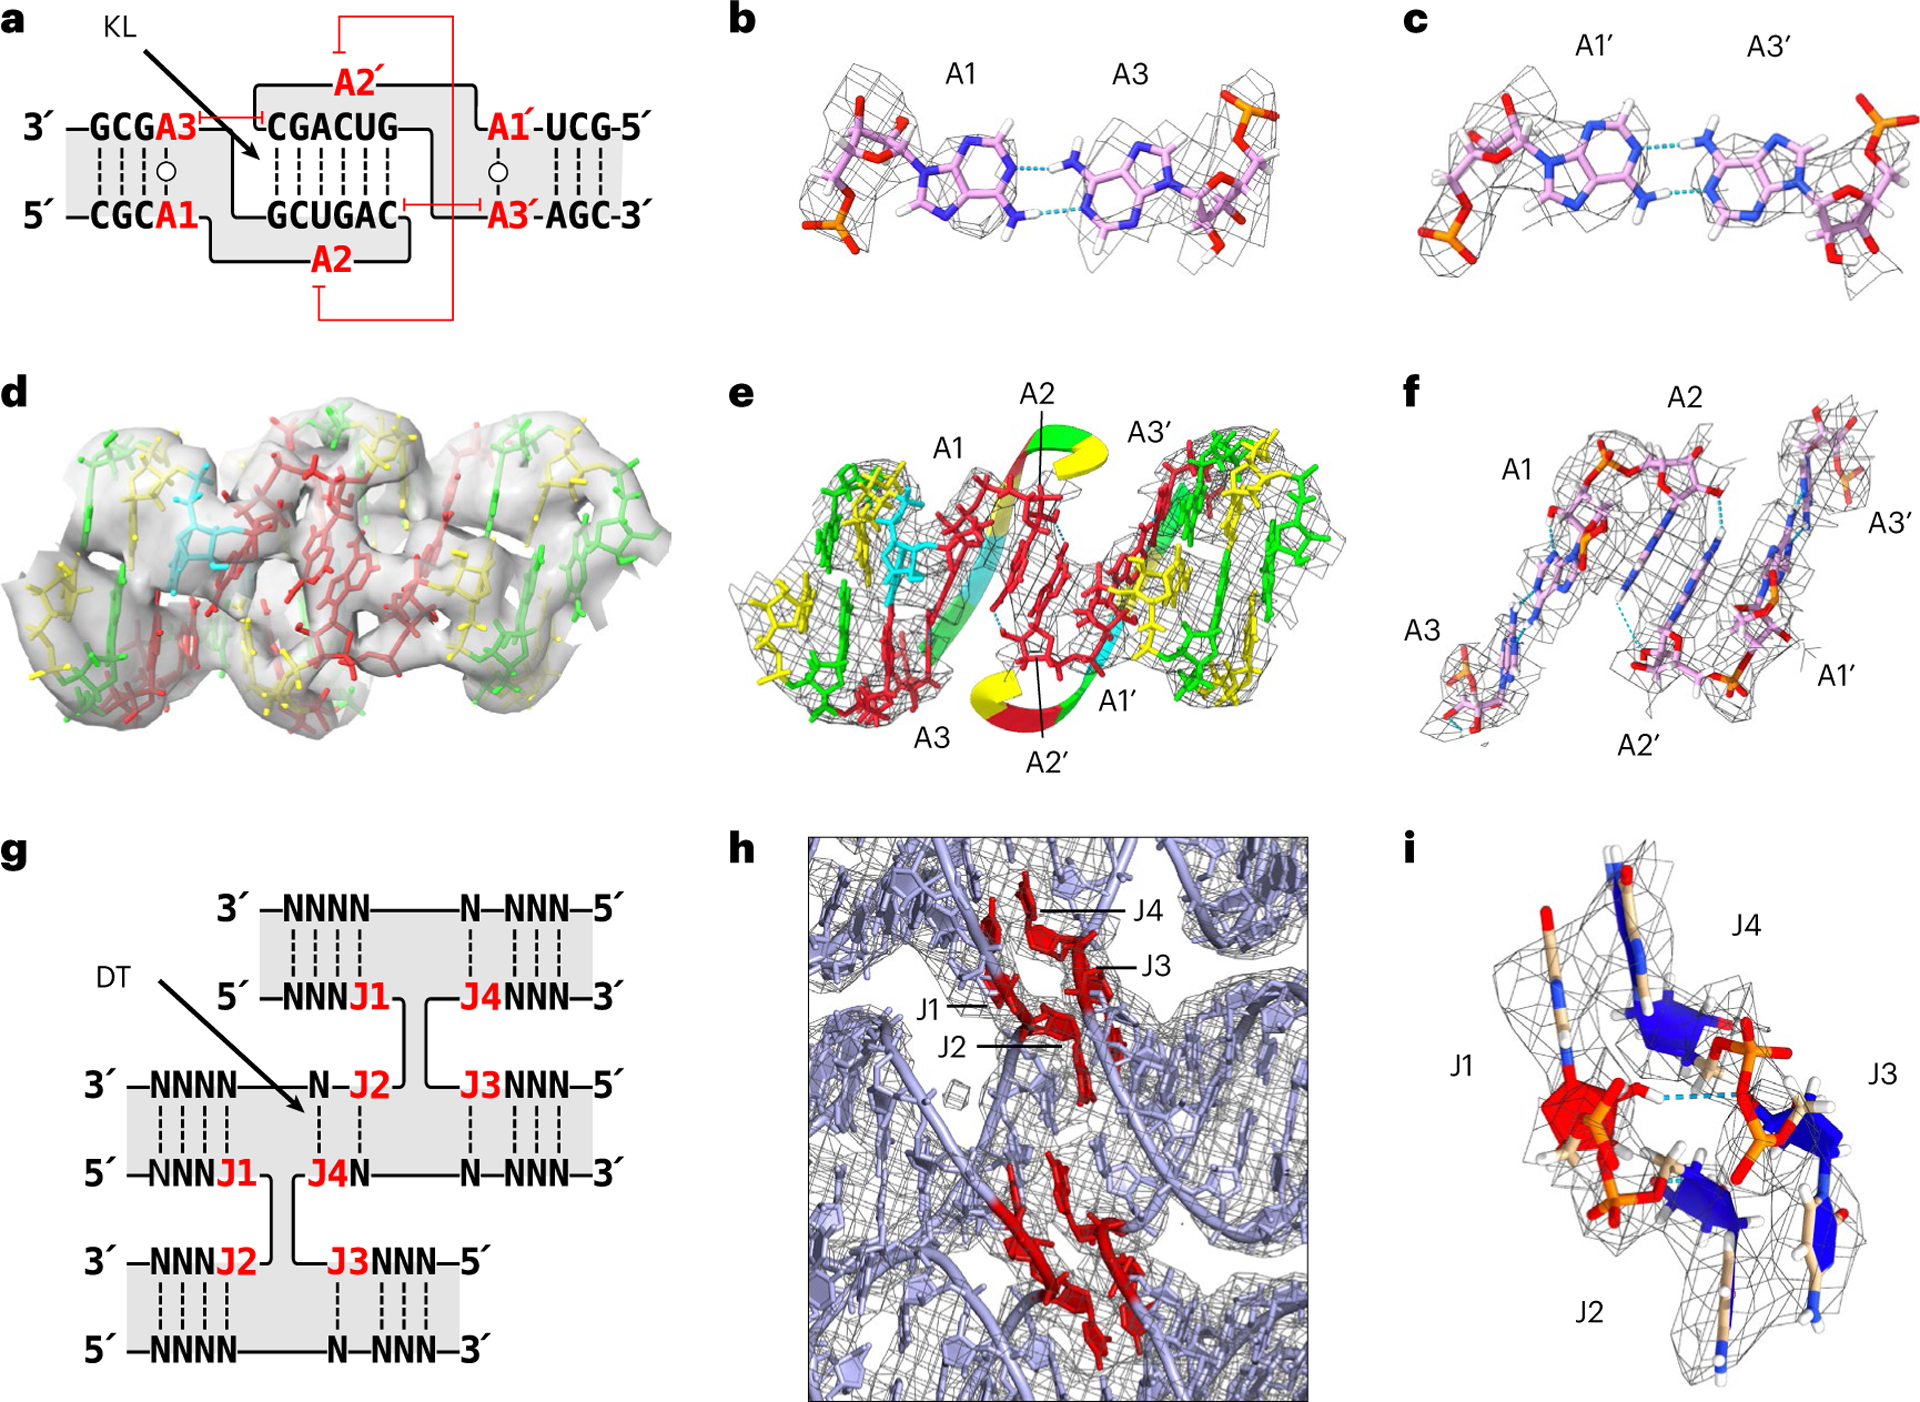
Fig. 3 |. Tertiary structure of KL and crossover motifs.

a, Secondary structure of the KL motif with the annotation of A1–A3. The capped red lines annotate stacking. b,c, Trans-Watson–Crick base pair of A1:A3 (b) and A1′:A3′ (c) from H3 KL are shown with the EM map as a mesh. d, A 3D model of KL3 of 5HT-A in the EM map. Nucleotides coloured by base (green, guanine; yellow, cytosine; red, adenine; blue, uracil). e, A 3D model of KL3 of 5HT-A showing the base stack of A2:A2′ across the major groove. The EM map is shown as a mesh around the displayed nucleotides. The 6 bp kissing nucleotides are ‘hidden’ to highlight the A2:A2′ base stack by displaying it as a ribbon and hiding the EM map mesh. f, Zoomed-in view of the A1:A3/A1’:A3’ base pairs and A2:A2′ base stack with the EM map shown as a mesh around the displayed nucleotides. g, Secondary structure of the crossover junction with annotation of J1–J4. Here J refers to junction nucleotides and are numbered from 5′ to 3′, and N represents any nucleotide. h, View of the crossover junctions between H1, H2 and H3 of 5HT-A shown with the EM map as a mesh. J1–J4 are highlighted in red. i, View of J1–J4 shown with the EM map as a mesh. C3′-endo nucleotides are coloured blue and C2′-endo nucleotides, red.
