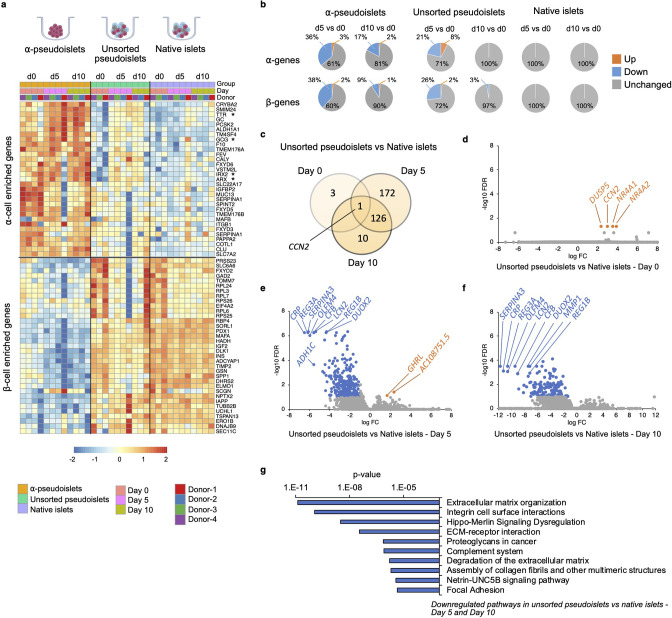
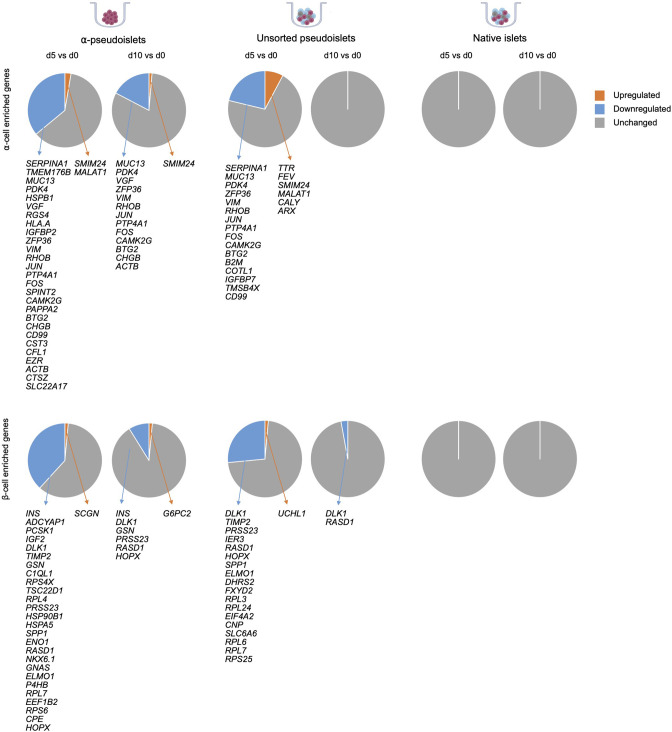
Figure 4. Changes in gene expression levels driven by dissociation and re-aggregation of human islet cells.
(a) Heatmap showing expression levels of α-cell enriched and β-cell enriched genes in α-pseudoislets, unsorted pseudoislets, and native islets on days 0, 5, and 10. Asterisks show genes associated with α-cell identity and function (GCG, ARX, IRX2, TTR). (b) Pie charts showing percentage of α-cell enriched (top panel) and β-cell enriched (bottom panel) genes that alter in α-pseudoislets, unsorted pseudoislets, and native islets on day 5 or day 10 compared to day 0. See also Figure 4—figure supplement 1. (c) Transcriptome of unsorted pseudoislets was compared with native islets on days 0, 5, 10. Venn diagram shows number of differentially expressed genes (DEGs) between unsorted pseudoislets and native islets on different days. (d–f) Volcano plots showing genes downregulated (blue) or upregulated (orange) significantly (FC < –2 or FC > 2, respectively, FDR < 0.1) on day 0 (d), day 5 (e), and day 10 (f). Gray shows non-significant genes with FDR > 0.1 and –2 < FC < 2. (g) Top 10 pathways downregulated in unsorted pseudoislets on day 5 and day 10 compared to native islets. n=4 donors; α-pseudoislets d0, d5, d10, unsorted pseudoislets d5, native islets d5, d10, and n=3 donors; unsorted pseudoislets d0, d10, native islets d0 (a–g).


