. 2023 Oct 11;12:e86452. doi: 10.7554/eLife.86452

Figure 1. OPA1 BKO mice have higher resting metabolic rates and are completely resistant to diet-induced obesity (DIO).

(A–D) Data collected on 12-week-old male OPA1 BKO mice. (A) Body mass. (B–G) Indirect calorimetry data represented as the average for the light and dark cycles during the last 48 hr of data recording. (B) Food intake. (C) Locomotor activity. (D) Oxygen consumption (VO2). (E) Carbon dioxide production (VCO2). (F) Respiratory exchange ratio. (G) Energy expenditure. (H) ANCOVA of energy expenditure as a function of body mass. (I–Q) Data collected on 18-week-old male OPA1 BKO mice fed high-fat diet (60% calories from fat) for 12 wk (diet started at 6 wk of age). (I) Body weight curve. (J) Final body weight (cohort used for indirect calorimetry data collection). (K–Q) Indirect calorimetry data represented as the average for the light and dark cycles during the last 48 hr of data recording. (K) Food intake. (L) Locomotor activity. (M) Oxygen consumption (VO2). (N) Carbon dioxide production (VCO2). (O) Respiratory exchange ratio. (P) Energy expenditure. (Q) ANCOVA of energy expenditure as a function of body mass. Data are expressed as means ± SEM. Significant differences were determined by Student’s t-test using a significance level of p<0.05. *Significantly different vs. wild-type (WT) mice.

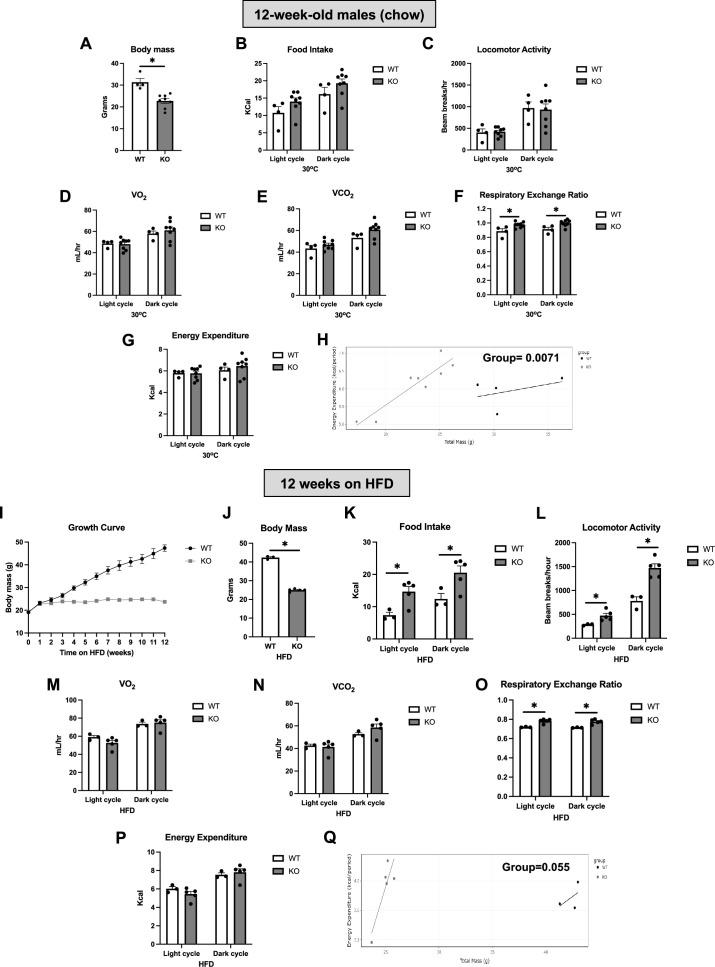
Figure 1.

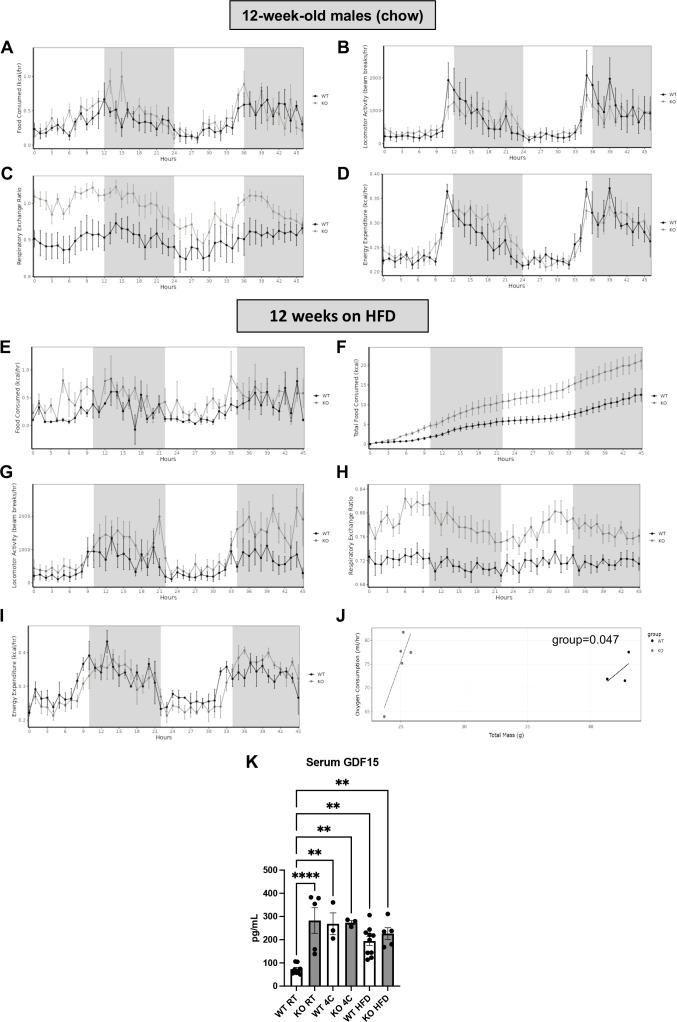
Figure 1—figure supplement 1. Food consumption, locomotor activity, and energy expenditure in OPA1 BAT knockout (KO) mice under baseline conditions and following high-fat feeding.

Figure 1—figure supplement 1.

(A–D) Hourly indirect calorimetry data during the light and dark cycles in the last 48 hr of data recording. Data was collected from 12-week-old male OPA1 BAT KO and control mice, consuming normal chow. (A) Hourly food consumed. (B) Locomotor activity. (C) Respiratory exchange ratio. (D) Energy expenditure. (E–I) Hourly indirect calorimetry data during the light and dark cycles in the last 48 hr of data recording. Data was collected from 18-week-old male OPA1 BAT KO and wild-type (WT) control mice fed high-fat diet (HFD – 60% calories from fat) for 12 wk (diet started at 6 wk of age). (E) Hourly food consumption. (F) Cumulative food consumption. (G) Locomotor activity. (H) Respiratory exchange ratio. (I) Energy expenditure. (J) ANCOVA of oxygen consumption as a function of body mass for HFD mice. (K) Serum GDF15 levels in OPA1 BKO mice under baseline conditions, after cold exposure (3 d at 4°C) and after 12 wk of high-fat feeding. Data are expressed as means ± SEM. Significant differences for the group effect were determined by ANCOVA using a significance level of p<0.05. One-Way ANOVA was used to determine the differences in GDF15 serum levels using a significance level of p<0.05. ** p <0.01. **** p <0.0001. Significantly different vs. WT RT.